Apollo Hospitals Enterprise Ltd
Hospital & Healthcare Services
Apollo Hospitals Enterprise Ltd
Hospital & Healthcare Services
Stock Info
Shareholding Pattern
Price performance
Indexed Stock Performance
India’s Largest Healthcare Service Provider
Company Profile
Started operations in the year 1983, Apollo Hospitals Enterprise Limited (Apollo
Hospitals) is India’s largest healthcare service provider. It has emerged
as the foremost integrated healthcare provider in Asia, with group companies that
specialise in, pharmacy, consultancy, clinics, and many such key touch points of
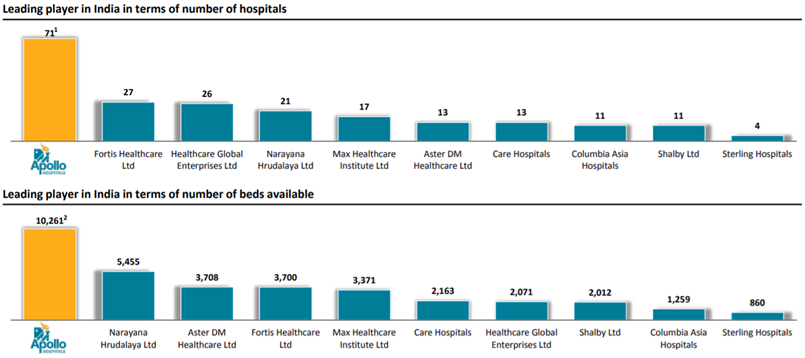
the ecosystem. It is the leading player in terms of number of hospitals and number
of beds available. It has 70 hospitals with the total capacity of 10,200+ beds across
the country. It also has largest pan-India pharmacy network with 3,900+ outlets.
Its extensive pharmacy network also supports the growth of Apollo 24/7.

Consolidated Financial Statements
| Rs. in Crores | Net Sales | EBITDA | EBITDAM | PAT | EPS | ROE | P/E | EV/EBITDA |
|---|---|---|---|---|---|---|---|---|
| FY19 | 9617.40 | 1062.70 | 11.05% | 236.00 | 16.90 | 6.80% | 72.41 | 19.19 |
| FY20 | 11246.80 | 1580.90 | 14.06% | 454.90 | 32.57 | 13.11% | 34.86 | 11.99 |
| FY21E | 10825.80 | 1139.81 | 10.53% | 90.70 | 6.50 | 2.60% | 504.38 | 43.03 |
| FY22E | 13383.13 | 1905.20 | 14.24% | 885.95 | 63.44 | 20.64% | 51.64 | 25.31 |
| FY23E | 15445.02 | 2411.32 | 15.61% | 1065.91 | 76.33 | 22.28% | 42.92 | 19.54 |
Investment Rationale
Strong Brand with Dominant Position in the Healthcare Sector
Apollo Hospitals has maintained a strong brand position for more than three decades
and is widely recognised as the pioneer of private healthcare segment in India.
Lines of business include (i) healthcare services through multi-specialty hospitals,
(ii) Pharmacy Platform which includes retail pharmacy with a network of stand-alone
pharmacies, and (iii) other healthcare services through retail healthcare network,
which includes diagnostics, primary care, and specialty care facilities. It was
the country’s first corporate hospital. It is also the first to bring MRI,
PET CT, proton therapy (Proton Centre of the company located in Chennai, is the
first-of-its kind in South East Asia and people from all over the world visit for
treatment), etc. in India. The group's reputation has helped to attract well-known
doctors and other healthcare professionals to its facilities from India and abroad,
who in turn, draw more patients. Strong track record in building long-term relationships
with doctors and other medical professionals together with focus on achieving and
maintaining world-class clinical outcomes have enabled it to build a strong brand
name.
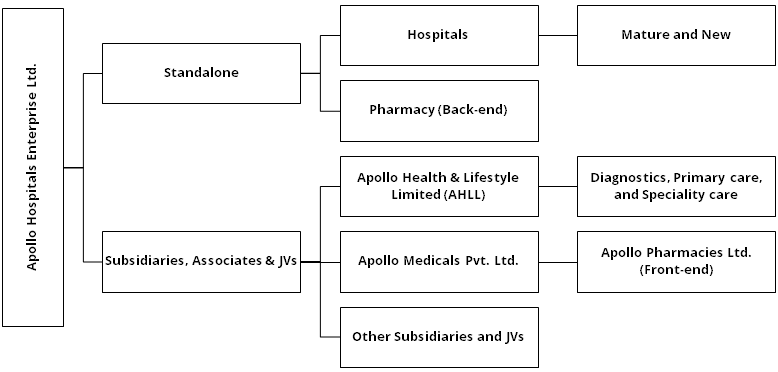
As of September, 2020, it operated 70 hospitals (45 Owned Hospitals, 21 Day Care Centres/CARDLE, and 4 Managed Hospitals) with the total capacity of 10,200+ beds. Apollo increased its bed capacity by ~2,340 beds between FY12 and FY17, which resulted into dilution of its margins and return profile. Since then, it has spent less money and consolidated its operations, resulting in a pre-tax ROCE of 14.6% in FY20, up from 7% in FY18. Its primary markets are Chennai and Hyderabad, but it has since expanded to include cities such as Mumbai and Ahmedabad, as well as tier-II and tier-III towns. Strong brand equity and superior service quality are driving the company's strong market position. Given its large geographic footprint and diverse specialty mix, Apollo Hospitals is expected to maintain its leadership position over the medium term.

1.Data as of March 2020.
Source: Investor Presentation; StockAxis Research
Pharmacy Platform with an Interest in the Largest and Fastest Growing Pharmacy
Network in India
Apollo Pharmacy is India's largest organised retail pharmacy network, with 3,900+
outlets in 400 cities/towns across 21 states and four union territories. It has
now enhanced offerings extensively to include a wide variety of wellness products
in addition to the traditional pharmaceutical products and built an effective supply
chain with strong distribution channels. Apollo's 24/7, e-pharmacy, and offline
store presence provide access to 13,500+ pin codes.
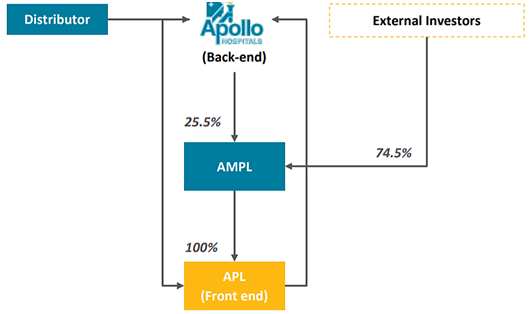
The pharmacy business accounted for ~43% of overall revenues as of FY20. The revenue growth has been robust at 22.15% CAGR during FY15 – FY20 aided by store addition and higher revenue per store. The operating margin improved to ~6% in FY20 from 3.3% in FY15, supported by cost rationalisation and increased share of private labels. The share of private label sales in the turnover has increased from 6% in FY18 to ~10% in FY20 and it is expected to increase further in the coming years. The company completed the reorganisation of the standalone pharmacies (SAP) business in Q2FY21, with front-end pharmacies being transferred to Apollo Pharmacies Ltd.(APL) for consideration of ~USD 72 million (~INR. 533 crores). While the company now owns 25.5% of APL, it still controls the wholesale distribution of the pharmaceutical business as the exclusive supplier to APL. With the front-end retail pharmacy business through interest in APL and its own pharmacy distribution business both experiencing steady growth, pharmacy platform is expected to continue to be a strong pillar and contribute to its financial resilience and diversity.

Source: Investor Presentation; StockAxis Research
High Quality Healthcare Using Advanced Technology and Innovation
Apollo Hospitals continuously invest in medical technology and equipment and modernise
hospital facilities to offer high quality healthcare services and expand range of
healthcare services. It has been the first healthcare services provider to introduce
many cutting-edge medical technologies, equipment, and treatments in the India including
Proton beam therapy, multidetector CT scanner, MRI system, and robotic surgical
systems. The availability of sophisticated medical technology ensures that the company
is among the few healthcare services providers in India who can offer advanced healthcare
procedures.
In recent years, it has had multiple technology collaborations, including Microsoft to develop and deploy new AI-powered cardiovascular disease risk score application, a collaboration with Zebra Medical Vision in Israel to validate and co-develop a medical imaging using AI, and a partnership with Google to launch a new search feature which would allow patients to identify symptoms of diseases at their homes.
Additionally, it has built an integrated online platform (Ask Apollo) which allows patients to make doctor appointments online and to schedule online consultations. In FY20, it also launched comprehensive mobile app (Apollo 24/7), which provides patients with a broad suite of services. Investments in latest and advanced technology and equipment has enabled the company to attract renowned doctors from the country and abroad and has made its hospitals, the preferred treatment destination.
Apollo 24/7 – Growth Enabler
The company has launched a comprehensive mobile application, Apollo 24/7,
which provides patients with virtual consultation with doctors, online diagnostic
booking, and medical records. Apollo 24/7 also hosts an online pharmacy. The online
orders for medicines and other products made via application are directly fulfilled
by APL. The integrated offerings will drive better customer experience, funnel patients
into the Apollo network and allow the company to tap into the growing e-health market
of India. Going forward, Apollo 24/7 will provide a complete suite of service offerings
including condition management, health predictor, well-being companion and health
insurance. As of November, 2020, there are ~5 million registered users on Apollo
24/7 and the company have performed 230,000 online consultations. Also, as of September,
2020, there were more than 3,200 doctors on the Apollo 24/7 tele-consultation platform
covering 50 specialties. The company believes it is ready for a pan-India launch
of the same and can generate potential revenue of Rs.1,000 crores from this segment
in the next 3-4 years.
Vaccine Drive to Improve Profitability
India is undergoing a massive vaccination programme and the Union Government has
liberalised the procurement of Covid-19 vaccines from 1st May by allowing
private hospitals and corporates to directly buy vaccines from manufacturers and
administer them to people. For private hospitals, such as Apollo Hospitals, the
cost of purchase of Covishield from Serum Institute of India (SII) is Rs. 600 plus
5% GST, totalling to Rs. 630. Apollo Hospitals used to get a profit per jab of Rs.
120. However, on 7th June the Central Government has capped the service
charges of Rs. 150 per dosage and we expect the profit per jab to be Rs. ~75 per
jab. The company said that the Rs. 150 cap on Covid-19 vaccine administration charges
doesn't make any difference to their vaccination programme.
Currently, it is administering 70,000 jabs/day which will increase to 100,000 jabs/day. It also has the bandwidth to raise the number of doses to 200,000 jabs/day. So far, it has administered 1.2 million doses. We have considered FY22E profit from vaccine of Rs. 225 crores considering ~1,00,000 jabs a day at Rs. 75 profit per jab for 300 days. For FY23E, we have assumed that most of the people will be done with two jabs. So, we have considered Rs. 15 crores of profit from jabs in FY23E. We expect Covid-19 vaccination to benefit Apollo Hospitals as it will help it get higher consultations, cross-sell wellness, and other things.
Major Capex is Behind
With significant bed addition in the last decade, the major capex is behind. During
FY15 – FY19, the company had done a cumulative capex of ~Rs. 3,450 crores
and in last three years, it has consolidated its operations. No greenfield expansion
is expected from the company but it could evaluate some small acquisitions in North
and East India. Further, in January 2021, the company has raised ~Rs. 1,170 crores
via QIPs and the company’s balance sheet remains in a comfortable position.
Limited capex and improving profitability will enable to company to generate free
cash flows and improve ROCE.
Outlook & valuation
Apollo Hospitals is India’s largest healthcare services provider and given its large geographic footprint and diverse specialty mix, Apollo Hospitals is expected to maintain its leadership position over the medium term. With the front-end retail pharmacy business through interest in APL and its own pharmacy distribution business both experiencing steady growth, pharmacy platform is expected to continue to be a strong pillar and contribute to its financial resilience and diversity. Also, the pan-India launch of the Apollo 24/7 application could generate potential revenue of Rs. 1000 crores in the next 3-4 years. The stock is trading at 19.5x of EV/EBITDA of FY23E.
Financial Statement
Profit & Loss statement
| Year End March (Rs. in Crores) | 2019 | 2020 | 2021E | 2022E | 2023E |
|---|---|---|---|---|---|
| Net Sales | 9617.40 | 11246.80 | 10825.80 | 13383.13 | 15445.02 |
| Expenditure | |||||
| Material Cost | 4660.90 | 5498.90 | 5521.16 | 6691.56 | 7722.51 |
| Employee Cost | 1598.20 | 1852.90 | 1945.55 | 2042.82 | 2144.96 |
| Other Expenses | 2295.60 | 2314.10 | 2219.29 | 2743.54 | 3166.23 |
| EBITDA | 1062.70 | 1580.90 | 1139.81 | 1905.20 | 2411.32 |
| EBITDA Margin | 11.05% | 14.06% | 10.53% | 14.24% | 15.61% |
| Depreciation & Amortization | 395.50 | 619.70 | 570.00 | 620.00 | 670.00 |
| EBIT | 667.20 | 961.20 | 569.81 | 1285.20 | 1741.32 |
| EBIT Margin % | 6.94% | 8.55% | 5.26% | 9.60% | 11.27% |
| Other Income | 32.40 | 33.10 | 33.00 | 33.00 | 33.00 |
| Interest & Finance Charges | 327.00 | 532.80 | 467.43 | 434.93 | 369.93 |
| Profit Before Tax - Before Exceptional | 372.60 | 461.50 | 135.38 | 883.27 | 1404.39 |
| Profit Before Tax | 372.60 | 660.00 | 135.38 | 883.27 | 1404.39 |
| Tax Expense | 173.40 | 225.10 | 44.68 | 222.32 | 353.48 |
| Exceptional Items | - | 198.50 | - | - | - |
| Net Profit | 199.20 | 434.90 | 90.70 | 885.95 | 1065.91 |
| Net Profit Margin | 2.07% | 3.87% | 0.84% | 6.62% | 6.90% |
| Consolidated Net Profit | 236.00 | 454.90 | 90.70 | 885.95 | 1065.91 |
| Net Profit Margin after MI | 2.45% | 4.04% | 0.84% | 6.62% | 6.90% |
Balance Sheet
| As of March (Rs. in Crores) | 2019 | 2020 | 2021E | 2022E | 2023E |
|---|---|---|---|---|---|
| Share Capital | 69.60 | 69.60 | 69.60 | 69.60 | 69.60 |
| Total Reserves | 3261.10 | 3266.50 | 3287.38 | 4089.54 | 5071.65 |
| Shareholders' Funds | 3469.00 | 3469.80 | 3490.98 | 4293.14 | 5275.25 |
| Non Current Liabilities | |||||
| Long Term Borrowing | 2952.10 | 2852.00 | 3098.10 | 2598.10 | 2098.10 |
| Deferred Tax Assets / Liabilities | 297.50 | 244.60 | 244.60 | 244.60 | 244.60 |
| Long Term Provisions | 883.00 | 1011.20 | 1011.20 | 1011.20 | 1011.20 |
| Current Liabilities | |||||
| Short Term Borrowings | 498.20 | 497.50 | 497.50 | 497.50 | 497.50 |
| Trade Payables | 713.10 | 908.80 | 967.57 | 1061.21 | 1263.70 |
| Other Current Liabilities | 640.80 | 807.80 | 561.70 | 561.70 | 561.70 |
| Short Term Provisions | 103.30 | 123.20 | 123.20 | 123.20 | 123.20 |
| Total Equity & Liabilities | 10037.40 | 12289.90 | 12369.85 | 12765.65 | 13450.25 |
| Assets | |||||
| Net Block | 4975.10 | 7426.20 | 7356.20 | 7236.20 | 7066.20 |
| Non Current Investments | 399.30 | 365.10 | 365.10 | 365.10 | 365.10 |
| Long Term Loans & Advances | 1431.60 | 1598.40 | 1598.40 | 1598.40 | 1598.40 |
| Current Assets | |||||
| Currents Investments | 68.80 | 74.90 | 161.30 | 161.30 | 161.30 |
| Inventories | 584.70 | 737.70 | 816.38 | 895.40 | 1066.25 |
| Sundry Debtors | 1023.20 | 1027.20 | 1179.22 | 1293.35 | 1540.13 |
| Cash and Bank | 346.90 | 466.80 | 299.64 | 622.30 | 1059.27 |
| Short Term Loans and Advances | 79.40 | 96.70 | 96.70 | 96.70 | 96.70 |
| Total Assets | 10037.40 | 12289.90 | 12369.85 | 12765.65 | 13450.25 |
Cash Flow Statement
| Year End March (Rs. in Crores) | 2019 | 2020 | 2021E | 2022E | 2023E |
|---|---|---|---|---|---|
| Profit After Tax | 199.20 | 434.90 | 90.70 | 885.95 | 1065.91 |
| Depreciation | 395.50 | 619.70 | 570.00 | 620.00 | 670.00 |
| Changes in Working Capital | -46.00 | -70.40 | -171.94 | -99.50 | -215.14 |
| Cash From Operating Activities | 905.20 | 1292.80 | 488.77 | 1406.45 | 1520.76 |
| Purchase of Fixed Assets | -678.90 | -513.00 | -500.00 | -500.00 | -500.00 |
| Free Cash Flows | 226.30 | 779.80 | -11.23 | 906.45 | 1020.76 |
| Cash Flow from Investing Activities | -710.60 | -288.80 | -500.00 | -500.00 | -500.00 |
| Increase / (Decrease) in Loan Funds | 234.80 | -57.10 | - | -500.00 | -500.00 |
| Equity Dividend Paid | -83.70 | -155.10 | -69.83 | -83.79 | -83.79 |
| Cash from Financing Activities | -214.70 | -909.50 | -69.83 | -583.79 | -583.79 |
| Net Cash Inflow / Outflow | -20.10 | 94.50 | -81.06 | 322.66 | 436.97 |
| Opening Cash & Cash Equivalents | 306.30 | 286.20 | 380.70 | 299.64 | 622.30 |
| Closing Cash & Cash Equivalent | 286.20 | 380.70 | 299.64 | 622.30 | 1059.27 |
Key Ratios
| Year End March | 2019 | 2020 | 2021E | 2022E | 2023E |
|---|---|---|---|---|---|
| Basic EPS | 16.90 | 32.57 | 6.50 | 63.44 | 76.33 |
| Diluted EPS | 16.90 | 32.57 | 6.50 | 63.44 | 76.33 |
| Cash EPS (Rs) | 45.22 | 76.95 | 47.31 | 107.84 | 124.30 |
| DPS | 6.00 | 6.00 | 5.00 | 6.00 | 6.00 |
| Book value (Rs/share) | 248.42 | 248.46 | 249.98 | 307.42 | 377.74 |
| ROCE (%) Post Tax | 5.50% | 7.41% | 5.81% | 13.63% | 17.40% |
| ROE (%) | 6.80% | 13.11% | 2.60% | 20.64% | 22.28% |
| Inventory Days | 21.83 | 21.46 | 26.20 | 23.34 | 23.18 |
| Receivable Days | 35.08 | 33.27 | 37.20 | 33.72 | 33.48 |
| Payable Days | 25.03 | 26.32 | 31.63 | 27.67 | 27.47 |
| PE | 72.41 | 34.86 | 504.38 | 51.64 | 42.92 |
| P/BV | 4.94 | 4.58 | 13.11 | 10.66 | 8.67 |
| EV/EBITDA | 19.19 | 11.99 | 43.03 | 25.31 | 19.54 |
| Dividend Yield (%) | 0.49% | 0.53% | 0.15% | 0.18% | 0.18% |
| P/Sales | 1.78 | 1.41 | 4.23 | 3.42 | 2.96 |
| Net debt/Equity | 0.94 | 0.88 | 0.94 | 0.58 | 0.26 |
| Net Debt/ EBITDA | 3.06 | 1.93 | 2.89 | 1.30 | 0.57 |
| Sales/Net FA (x) | 1.97 | 1.81 | 1.46 | 1.83 | 2.16 |