
Angel Broking Ltd
Finance - Stock Broking
Angel Broking Ltd
Finance - Stock Broking
Stock Info
Shareholding Pattern
Price performance
Indexed Stock Performance
Angel Broking Limited is One of the Largest Retail Broking Houses in India in Terms of Active Clients on NSE
Company Profile
Incorporated in 1996, Angel Broking Limited (ABL) is technology-led financial services
company providing broking and advisory services, margin funding, loans against shares,
and financial products distribution to its clients. Broking and allied services
are offered through: a) online and digital platforms, and b) network of 15,000+
Authorized Persons (AP). It is the largest stock broking house in authorised persons
registered with NSE, 4th largest in NSE active clients and 3rd
largest in incremental NSE active client base. During FY21, the company achieved
highest gross client acquisition of 2.4 million, thereby more than doubling the
overall client base to 4.1 million in March 2021 up from 1.8 million in March 2020.
This client addition translates into 16.2% market share in incremental Demat accounts
for FY21 vs. 6.9% in FY17. Its customer outreach spans across 97.9% or 18,854 pin
codes in India.
Consolidated Financial Statements
| Rs. in Crores | Net Sales | EBITDA | EBITDAM | PAT | EPS | ROE | P/E | EV/EBITDA |
|---|---|---|---|---|---|---|---|---|
| FY19 | 762.62 | 187.67 | 24.61% | 79.84 | 11.06 | 15.02% | 79.09 | 33.05 |
| FY20 | 724.62 | 155.64 | 21.48% | 82.35 | 11.37 | 13.92% | 76.68 | 34.65 |
| FY21 | 1263.68 | 435.50 | 34.46% | 296.86 | 36.15 | 26.25% | 24.17 | 14.90 |
| FY22E | 1479.69 | 509.86 | 34.46% | 341.76 | 41.62 | 23.60% | 21.07 | 15.59 |
| FY23E | 1670.89 | 583.21 | 34.90% | 388.92 | 47.36 | 21.65% | 18.52 | 12.80 |
Investment Rationale
Significant Scale Up in Turnover and Market Share Across Segments
In FY21, ABL reached out to more clients across India, which resulted in expansion
of active base, which further resulted in best-ever Average Daily Turnover (ADTO)
across all segments:
- Overall retail equity ADTO increased by 380.1% YoY to Rs. 2 trillion, with March 2021 ADTO being at Rs. 4 trillion.
- Retail F&O ADTO increased by 442.9% YoY to Rs. 1.8 trillion, with March 2021 ADTO being at Rs. 3.9 trillion.
- Retail cash ADTO increased by 120.2% YoY to Rs. 64.4 billion, with March 2021 at Rs. 54.6 billion.
- Retail commodity ADTO increased by 51.7% YoY to Rs. 56.6 billion, with March 2021 ADTO being at Rs. 51.7 billion.
- Retail currency ADTO increased by 162.8% YoY to Rs. 18.6 billion, with March 2021 being at Rs. 27.7 billion.
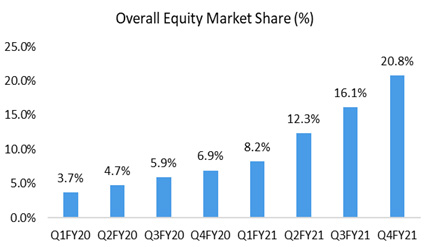
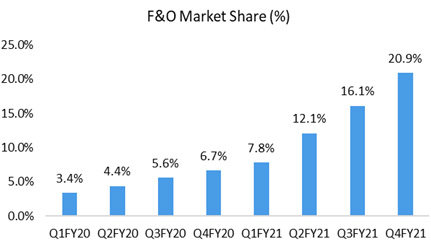
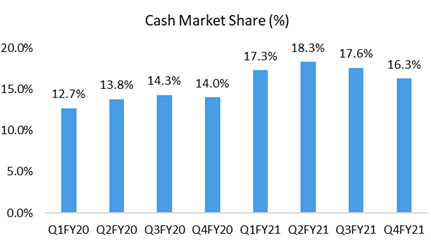
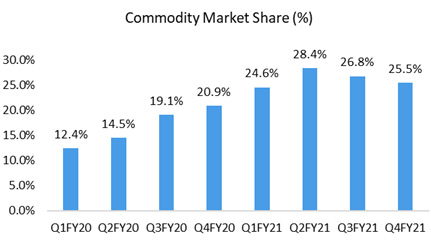
This robust growth in the company’s ADTO has resulted in expansion in its retail turnover market share across segments:
- Overall retail equity turnover market share expanded by 1,511bps to 21.5% in March 2021 over March 2020.
- Retail F&O turnover market share expanded by 1,551bps to 21.7% in March 2021 over March 2020.
- Retail cash turnover market share expanded by 256bps to 14.5% in March 2021 over March 2020.
- Retail commodity turnover market share expanded by 669bps to 24.7% in March 2021 over March 2020.
Source: Investor Presentation; StockAxis Research
Robust Client Acquisition – Driven by Digital Transformation
During FY21, the company achieved highest gross client acquisition of 2.4 million,
thereby more than doubling the overall client base to 4.1 million as of March 2021
up from 1.8 million in March 2020. It has successfully crossed the ‘5 Million
Clients’ milestone with an accelerated monthly client addition rate.
The share of incremental clients coming from Tier-II, Tier-III and beyond cities
increased to ~92% in FY21. This client addition translates into 16.2% market share
in incremental Demat accounts for FY21 as compared to 6.9% in FY17. Its superior
tech infrastructure has decreased its average client onboarding time to 5 minutes.
The Chief Growth Officer of the company said that the retail participation in India
is still slightly above 4%. So, the kind of response that the company is receiving
is merely the tip of the iceberg.
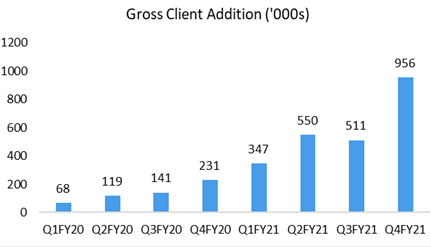
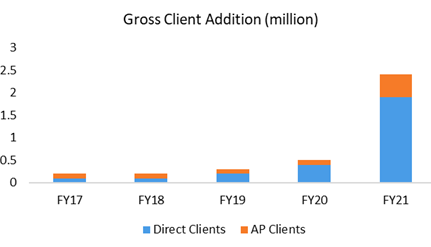
Source: Investor Presentation; StockAxis Research
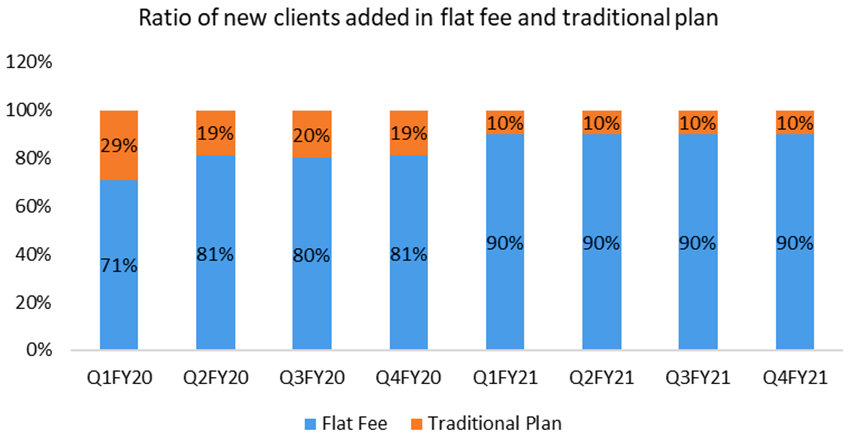
Currently, the company offers brokerage plans in flat brokerage plan, brokerage based on value traded, and sub-brokerage model (where it shares 30% of the brokerage income). Flat brokerage plan is catching up aggressively and has grown 18x over Q1FY20 to Q4FY21:
Source: Investor Presentation; StockAxis Research
Robust Growth in the NSE Active Client Base
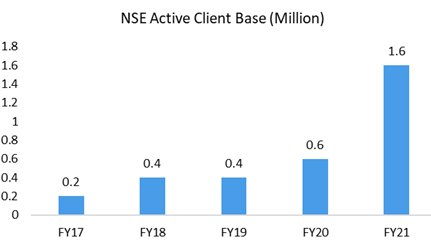
Robust acquisition of clients has translated into ~171% YoY growth in the NSE active
client base from 0.6 million as on March 2020 to 1.6 million as on March 2021. This
sharp improvement has helped the company to move up to 4th rank and acquire
a market share of 8.3% as of March 2021, an improvement of 294bps YoY.
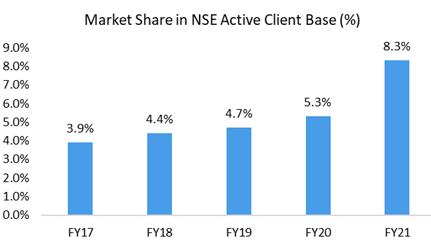
Source: Investor Presentation; StockAxis Research
Technology Adoption Building Operating Leverage
The company’s strategy of being a digital first organisation has enabled it
to grow the business at a faster pace. The vision of the company is “to become
the most preferred full stack Fintech platform for digital natives in India.”
It has moved everything to digital platforms from acquisition of clients, operations,
and client servicing, which is leading to a scalable and profitable business model.
Five years ago, in 2016, the company started its journey to create digital experience for existing and potential clients. Today, the initiative has resulted not only in better services but also in operational and cost efficiencies. The client on-boarding process is largely a straight through process, without any requirement for physical documentation; this has helped the company in reducing its client acquisition cost from ~Rs. 2,500/client in Q2FY20 to ~Rs. 700/client in Q1FY21 over the last year.

The emphasis on providing the clients with services through technological platforms has enabled ABL to rationalise the cost that it incurs to service the clients’ needs, leading to cost-efficiencies. This has enabled it to not only offer a simplified and most competitive pricing to the clients but also serve them with value added services such as research and advisory at no additional cost, margin trading facility, securities as collateral and no fund transfer charges. The company is well-placed to capitalise on the expected growth in the broking sector in India on the back of its digital presence, pricing, and early mover advantage in providing broking, financial and advisory services through online and offline channels.
Diversified Product Offering Across Segments at Competitive Price
The company’s various online platforms include Angel Broking, trade.angelbroking.com,
Angel SpeedPro, and Angel BEE. Its Angel iTrade Prime Plan was
launched comprising, Rs. 0 for equity delivery and Rs. 20 per order for all other
segments. Coupled with this competitive pricing plan, it also offers services such
as complementary in-house research and advisory, margin trading facility, securities
as collateral and no charges for any fund transfer. The company believes that this
complete offering is a unique proposition and makes it one of the most competitive
players across the industry.
Outlook & valuation
The broking industry in India is believed to be underpenetrated with retail participation slightly above 4% and the industry is expected to witness strong growth going ahead due to increased scalability and reach to untapped markets, especially lower tiered cities, by leveraging agile digital models. Angel Broking had started its digital transformation journey in 2016, and since then it has developed several state-of-the-art digital properties and ensured maximum client satisfaction which has resulted in highest-ever gross client addition, highest-ever ADTO, and robust growth in NSE active client base during Q4FY21.
It has also successfully crossed the ‘5 Million Clients’ milestone with an accelerated monthly client addition rate and management believes the response which the company is receiving is merely the tip of the iceberg and the industry could see impending storm of investors in the coming few years. We believe that the company is well-placed to capitalise on this growth on the back of its digital presence, pricing, and early mover advantage in providing broking, financial and advisory services through online and offline channels. At the current market price of Rs. 877, the stock is trading at 18.5x of FY23E earnings.
Financial Statement
Profit & Loss statement
| Year End March (Rs. in Crores) | 2019 | 2020 | 2021 | 2022E | 2023E |
|---|---|---|---|---|---|
| Net Sales | 762.62 | 724.62 | 1263.68 | 1479.69 | 1670.89 |
| Expenditure | |||||
| Material Cost | - | - | - | - | - |
| Employee Cost | 161.74 | 159.80 | 171.85 | 185.59 | 200.44 |
| Other Expenses | 413.21 | 409.19 | 656.34 | 784.23 | 887.24 |
| EBITDA | 187.67 | 155.64 | 435.50 | 509.86 | 583.21 |
| EBITDA Margin | 24.61% | 21.48% | 34.46% | 34.46% | 34.90% |
| Depreciation & Amortization | 20.00 | 20.92 | 18.36 | 20.20 | 22.40 |
| EBIT | 167.67 | 134.72 | 417.14 | 489.66 | 560.81 |
| EBIT Margin % | 21.99% | 18.59% | 33.01% | 33.09% | 33.56% |
| Other Income | 26.49 | 30.09 | 35.30 | 30.00 | 30.00 |
| Interest & Finance Charges | 69.74 | 49.96 | 42.32 | 62.95 | 71.07 |
| Profit Before Tax - Before Exceptional | 124.43 | 114.85 | 410.12 | 456.71 | 519.73 |
| Profit Before Tax | 124.43 | 114.85 | 410.12 | 456.71 | 519.73 |
| Tax Expense | 44.59 | 32.50 | 113.27 | 114.95 | 130.82 |
| Exceptional Items | - | - | - | - | - |
| Net Profit | 79.84 | 82.35 | 296.86 | 341.76 | 388.92 |
| Net Profit Margin | 10.47% | 11.36% | 23.49% | 23.10% | 23.28% |
| Consolidated Net Profit | 79.84 | 82.35 | 296.86 | 341.76 | 388.92 |
| Net Profit Margin after MI | 10.47% | 11.36% | 23.49% | 23.10% | 23.28% |
Balance Sheet
| As of March (Rs. in Crores) | 2019 | 2020 | 2021 | 2022E | 2023E |
|---|---|---|---|---|---|
| Share Capital | 72.00 | 72.00 | 81.83 | 81.83 | 81.83 |
| Total Reserves | 457.90 | 516.00 | 1045.25 | 1362.37 | 1710.24 |
| Shareholders' Funds | 531.44 | 591.42 | 1131.00 | 1448.12 | 1795.98 |
| Minority Interest | - | - | - | - | - |
| Non Current Liabilities | |||||
| Long Term Borrowing | 7.07 | 4.81 | 1.21 | 1.21 | 1.21 |
| Deferred Tax Assets / Liabilities | -7.57 | -4.89 | -4.70 | -4.70 | -4.70 |
| Long Term Provisions | 166.13 | 152.82 | 9.64 | 9.64 | 9.64 |
| Current Liabilities | |||||
| Short Term Borrowings | 864.75 | 486.07 | 1170.26 | 1345.26 | 1495.26 |
| Trade Payables | 637.76 | 939.49 | 2276.43 | 1745.39 | 1920.56 |
| Other Current Liabilities | 162.01 | 161.63 | 213.78 | 213.78 | 180.00 |
| Short Term Provisions | 9.32 | 14.46 | 283.10 | 283.10 | 180.00 |
| Total Equity & Liabilities | 2370.90 | 2345.82 | 5080.71 | 5041.79 | 5577.94 |
| Assets | |||||
| Net Block | 133.97 | 124.06 | 114.83 | 104.63 | 92.23 |
| Non Current Investments | - | - | - | - | - |
| Long Term Loans & Advances | 233.63 | 428.33 | 1440.06 | 1440.06 | 1440.06 |
| Current Assets | |||||
| Currents Investments | 14.91 | 35.27 | 5.54 | 5.54 | 5.54 |
| Inventories | 0.05 | 0.05 | - | 0.02 | 0.03 |
| Sundry Debtors | 214.64 | 39.03 | 227.70 | 187.90 | 237.37 |
| Cash and Bank | 985.97 | 1413.56 | 1877.45 | 1888.50 | 2387.57 |
| Short Term Loans and Advances | 774.64 | 293.82 | 1407.71 | 1407.71 | 1407.71 |
| Total Assets | 2370.90 | 2345.82 | 5080.71 | 5041.79 | 5577.94 |
Cash Flow Statement
| Year End March (Rs. in Crores) | 2019 | 2020 | 2021 | 2022E | 2023E |
|---|---|---|---|---|---|
| Profit After Tax | 79.84 | 82.35 | 296.86 | 341.76 | 388.92 |
| Depreciation | 20.00 | 20.92 | 18.36 | 20.20 | 22.40 |
| Changes in Working Capital | 536.34 | 458.24 | -1337.18 | -491.27 | 125.70 |
| Cash From Operating Activities | 708.76 | 643.30 | -944.38 | -129.32 | 537.01 |
| Purchase of Fixed Assets | -11.64 | -12.62 | -14.42 | -10.00 | -10.00 |
| Free Cash Flows | 697.12 | 630.68 | -958.79 | -139.32 | 527.01 |
| Cash Flow from Investing Activities | -19.36 | -28.13 | 24.80 | -10.00 | -10.00 |
| Increase / (Decrease) in Loan Funds | -274.40 | -375.36 | 690.44 | 175.00 | 150.00 |
| Equity Dividend Paid | -19.44 | -19.44 | -42.66 | -24.63 | -41.06 |
| Cash from Financing Activities | -365.47 | -448.89 | 894.12 | 150.37 | 108.94 |
| Net Cash Inflow / Outflow | 323.93 | 166.27 | -25.46 | 11.05 | 635.96 |
| Opening Cash & Cash Equivalents | 123.03 | 446.96 | 613.24 | 587.78 | 598.82 |
| Closing Cash & Cash Equivalent | 446.96 | 613.24 | 587.78 | 598.82 | 1234.78 |
Key Ratios
| Year End March | 2019 | 2020 | 2021 | 2022E | 2023E |
|---|---|---|---|---|---|
| Basic EPS | 11.06 | 11.37 | 36.15 | 41.62 | 47.36 |
| Diluted EPS | 11.06 | 11.37 | 36.15 | 41.62 | 47.36 |
| DPS | 2.70 | 2.70 | 12.86 | 3.00 | 5.00 |
| Book value (Rs/share) | 73.60 | 81.67 | 137.74 | 176.36 | 218.72 |
| ROCE (%) Post Tax | 8.30% | 9.51% | 19.35% | 15.26% | 14.53% |
| ROE (%) | 15.02% | 13.92% | 26.25% | 23.60% | 21.65% |
| Inventory Days | 0.02 | 0.02 | 0.01 | 0.00 | 0.01 |
| Receivable Days | 89.29 | 63.89 | 38.52 | 51.26 | 46.45 |
| Payable Days | 299.71 | 397.24 | 464.44 | 496.04 | 400.41 |
| PE | 79.09 | 76.68 | 24.17 | 21.07 | 18.52 |
| P/BV | 11.92 | 10.74 | 6.37 | 4.97 | 4.01 |
| EV/EBITDA | 33.05 | 34.65 | 14.90 | 15.59 | 12.80 |
| Dividend Yield (%) | 0.30% | 0.30% | 1.50% | 0.30% | 0.60% |
| P/Sales | 8.30 | 8.76 | 5.70 | 4.87 | 4.31 |
| Total debt/Equity | 1.64 | 0.83 | 1.04 | 0.93 | 0.83 |
| Sales/Net FA (x) | 6.11 | 5.62 | 10.58 | 13.49 | 16.98 |