During an IPO, the subscription number is the one figure that everybody quotes. A post says that the issue is subscribed 3 times on the first day, another says 2.4 times, and a third says that retail is only 0.7 times while institutions are at 9 times. Investors then ask which number is correct and what any of it means. The honest answer is that they can all be correct, because each one is a snapshot of a different category, at a different time, from a different source. This article explains what the subscription number actually measures, why the numbers for QIB, NII and retail differ so much by day and by time, and how to read them without being misled.
What a subscription number means
The subscription multiple is the number of shares that investors have bid for, divided by the number of shares offered in that category. If 100 shares are on offer and investors bid for 300, the issue is subscribed 3 times. The key point is that the denominator is the number of shares available to the public in that category, and it leaves out the shares that were already given to anchor investors before the issue opened. In one very large issue, investors had bid for about 110 crore shares against about 19.75 crore shares available for subscription, which gave a subscription of 5.57 times. The rest of the shares in the issue had already gone to anchors and other reserved portions, so they are not part of the figure. This is why you cannot work out the subscription by dividing the bids by the total issue size.

An IPO is also divided into categories, and each category has its own number. Qualified institutional buyers, or QIBs, are large institutions such as banks, insurance companies and foreign portfolio investors. Non institutional investors, or NIIs, are individuals who bid above ₹2 lakh, along with companies and trusts, and the category is often split into a small and a big part. Retail individual investors bid up to ₹2 lakh. There may also be reserved portions for employees or for shareholders of a parent company. When a website shows a single overall figure, it is a blend of all of these, and it can hide large differences between the categories.
The same issue at different times
The best way to understand why numbers differ is to look at the story of one issue. The table below shows snapshots from a recent very large issue, taken from news reports. They are rounded and the sources differ, so use them only to see the pattern.
| Point in time | What was reported |
|---|---|
| Day 1, about 3 PM | Overall 2.38 times, retail 0.61 times |
| Day 1, about 6 PM | Overall about 3.04 times, retail 0.73 times, institutions 9.04 times |
| Day 1, evening | Overall 3.16 times, QIB 9.42 times, NII 1.68 times |
| End of Day 2 | Overall 5.57 times |
| Day 3, 10 AM | QIB 13.31 times, NII 6.74 times, retail 1.68 times |
| Day 3, at the close | Overall 22.19 times, QIB 70.55 times |
At 3 PM on the first day, the issue was subscribed 2.38 times and retail was at 0.61 times, and by about 7 PM the total was 3.16 times, with QIBs at 9.42 times and NIIs at 1.68 times. On the third morning, QIBs were at 13.31 times, NIIs at 6.74 times and retail at 1.68 times. At the end of the third day, the issue was subscribed 22.19 times overall, and the QIB category was reported at 70.55 times. The same issue was therefore at about 2 times, 3 times, 5 times and 22 times, depending on when you looked, and the QIB number rose from about 9 times to about 70 times. Nothing was wrong with any of the reports. They were different moments in a three day process.

Why the numbers differ by time of day
Bidding does not happen at an even pace through the day. The exchanges show live updates during bidding hours, usually in intervals, and the figure keeps changing until the bidding closes on the last day. Websites collect the numbers at different times, so a post made at 11 AM and one made at 4 PM will not agree. The final number for each day is only available after the bidding window closes and the exchange has consolidated the bids, which is why the evening figures are higher than the afternoon figures. When you see a subscription number, ask what time it was recorded. A number without a time is hard to use.
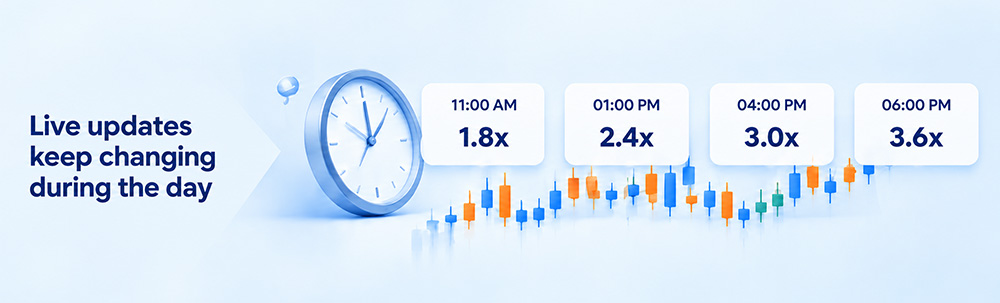
Why the numbers differ by day
Different kinds of investors tend to bid at different points of the three day window, and this is the most important reason for the pattern you see.

Retail investors often wait. Many retail applicants apply on the second or third day, after they have read the news, seen the subscription so far and checked the grey market, so the retail number on the first day is often lower than the number at the close. In the issue above, retail was at 0.61 times at 3 PM on the first day and 1.68 times by the morning of the third day, and the final figure came only after the close.
QIBs can go either way. In many issues, large institutions place their bids late, often in the last hours of the last day, after they have studied the demand and decided how much to bid. In some very large issues, institutions bid early. The issue above was fully subscribed within about 100 minutes of opening, driven by QIBs. Even then, the QIB number rose from about 9 times on the first day to about 70 times by the close, so a high number at the start is not the final story either.
NIIs typically bid late, and their numbers can jump on the last day. These investors include wealthy individuals, companies and family offices, and some of their bids are placed with borrowed money, which means that the number can swell on the final day and then reflect leverage and short term interest more than long term demand. Because their allotment is proportionate, a larger bid gets a larger number of shares, so some investors bid very large amounts. The NII number is therefore often the most volatile of the three.
So a low retail figure on Day 1 does not prove weak demand, and a high QIB figure on Day 1 does not prove that retail demand will follow.
Why the numbers differ by source
Even at the same time, two sources can show different numbers, for several reasons. Some include the shares allotted to anchors in the base and some leave them out. Some show the overall figure with the employee and shareholder portions and some show only the main categories. Some count all bids that have been placed, including bids at a lower price than the final price, and some count only the demand at the cut off price or the upper end of the band. Exchanges publish their data for bids placed through their own platforms, and consolidated data may come with a delay. Bids that fail a check, such as a UPI mandate that was not approved or a duplicate PAN, can be removed later, and bids can also be revised or cancelled until the close, so a number can even fall. The rule is simple. Use the exchange data, note the time, and treat figures from social media and news reports as approximate.
What each category tells you
| Category | Who bids | What the number tells you | What it does not tell you |
|---|---|---|---|
| QIB | Large institutions | How strongly professional investors want the shares at this price | The quality of the business, or how the stock will trade after listing |
| NII | Wealthy individuals, companies, trusts | Short term interest from larger investors, often late and sometimes financed by borrowing | Long term holding intent |
| Retail | Individuals bidding up to ₹2 lakh | Interest from small investors, and the difficulty of getting an allotment | Whether the price is fair |
A strong QIB number is useful, because institutions research the company and bid large amounts, but it is not a guarantee. The category is also not a measure of broad demand, since a small number of large bids can create a very high multiple. A strong retail number tells you that many small investors want the stock, which makes allotment harder, and it can add to the buying on the first day. None of the three numbers describes the value of the business or whether the price is right, and that is why a subscription number should be one input and not the whole decision.
The subscription number is not your chance of allotment
Many investors think that if a category is subscribed 10 times, they have a 1 in 10 chance of getting shares. This is not exactly right, and the difference is worth understanding. In the retail category, if the issue is heavily oversubscribed, allotment is made by a draw, and each successful applicant normally receives one lot. The chance of getting a lot is the number of lots available divided by the number of valid applications. The subscription multiple counts shares, not applications, and many applicants bid for several lots, so the two are different. Suppose the retail portion is subscribed 6 times in shares and the average applicant has bid for 3 lots. The number of applications is about twice the number of lots available, so the chance of getting one lot is about 50 percent, and not 1 in 6. If the average applicant bids for only one lot, the chance is about 1 in 6. This also shows why bidding for more lots in the retail category does not improve your odds in a draw, because the draw is among applications.
In the NII category, allotment is usually proportionate. If the category is subscribed 20 times and you bid for 75 lots, you can expect roughly a twentieth of what you asked for, which is about 3 or 4 lots, subject to rounding rules. The numbers explain how many shares you might receive, but the final basis of allotment is decided by the registrar, so check the prospectus and the allotment notice.
What subscription does and does not predict
A high subscription shows that there was a lot of demand at the issue price during the bidding days. It does not show that the price is fair, that the business is strong or that the stock will rise after listing. Axis Capital data reported earlier this year showed that many of the stocks trading well below their issue price had seen heavy demand during their offers, which suggests that oversubscription can reflect short term liquidity and sentiment and not long term business strength. Subscription numbers are also not the same as the grey market premium. The grey market is unofficial and can change quickly, as we explained in our article on GMP, while subscription numbers come from bids that were actually placed on the exchanges. Both are signals about demand and neither is a verdict on value.
A simple method for tracking subscription
Open the bidding page of the NSE or the BSE for the issue, and record the figures at fixed times, for example at the end of each day, noting the time and the source. Use a small sheet with columns for the day and time, the QIB, NII and retail numbers, the overall number and the source. Check the number of shares on offer in each category in the prospectus, so that you understand the denominator, and check whether the figure includes the anchor portion. Look at how the numbers change across the three days and not at one snapshot. Wait for the final figures after the close before drawing any conclusion, and then compare the final category numbers with the quota for each category. Finally, put the subscription next to your own research on the business and the price, and keep your plan for the allotment and the listing ready.
Mistakes to avoid
The first mistake is to quote a subscription number without its time and category. The second is to judge the issue from the first day, when retail numbers are usually low and institutional numbers can be early. The third is to compare the overall number of one issue with that of another, when the quotas and the sizes differ. The fourth is to assume that a high QIB number means a low risk. The fifth is to treat a very high NII number as proof of long term demand, when some of it may be short term and financed. The sixth is to confuse the subscription multiple with the chance of allotment. The seventh is to rely on screenshots and social media posts instead of the exchange data. The eighth is to forget that the numbers can change after the close, once invalid bids are removed. This article is for education and is not a recommendation to apply for any IPO, and every investment in the stock market carries risk, including the risk of loss of capital.
A subscription number is a moving snapshot of demand. It depends on which category you look at, which day and time it was recorded, and which source reported it. Retail investors tend to bid late, institutions can bid early or late, and the NII number can jump on the last day, so the first day tells you little and the final numbers after the close tell you the most. Learn what the denominator is, read each category for what it can show, remember that the multiple is not your chance of allotment, and treat strong demand as one input beside the business, the valuation and your own plan.