When an IT company reports its quarterly results, the first headline usually says that profit rose or fell by some percent. For IT services companies, this one number can mislead you. Profit can rise because the rupee became weaker, because the tax bill was lower, or because of a onetime item, while the underlying business is growing slowly. A second company can show a fall in profit while its business is in better shape. This is why investors who follow the sector compare companies on four things: growth, margin, deal wins and guidance. This season gives a good live example, because two large IT services companies reported within days of each other. In this article I will call them Company A and Company B, and I will use their numbers to show how the comparison works.
Step one: compare growth in constant currency, not in rupees
IT services companies in India earn most of their revenue in dollars and report their accounts in rupees. When the rupee becomes weaker, the same dollar revenue turns into more rupees, so reported growth in rupees looks better than the real growth of the business. To remove this effect, companies also report growth in constant currency, which means that the exchange rate is held at the level of the earlier period. The two numbers can be very far apart. Company A grew its revenue 11.5 percent year on year in rupees, but only 2.6 percent in constant currency. Company B grew its revenue 9.1 percent in rupees, but its constant currency revenue was unchanged from the previous quarter and rose only 0.6 percent from a year ago. If you looked only at rupee growth, the two companies would look alike, and both would look healthy. In constant currency, Company A is growing at a modest pace while Company B is almost flat.
After that, look at growth in two ways. Year on year growth compares the quarter with the same quarter last year and removes seasonal effects. Quarter on quarter growth, also called sequential growth, shows the current momentum. Company A grew 2.3 percent in constant currency from the previous quarter which tells you that growth is not slowing down. Next, look inside the total. At Company A, the IT and business services segment grew 4.4 percent in constant currency, the engineering and R&D services segment grew 2.1 percent, and the software segment fell 11.2 percent. A single total hides these differences, and the segment numbers tell you which part of the business is pulling the company up or down. Also check the growth by industry and by region, whether any acquisitions are included in the growth, and how the company compares with its peers. In the present environment, a growth rate of a few percent in constant currency is considered normal for large IT companies, so a rate near zero is a warning, and a rate well above the sector is something to understand before you celebrate.

Step two: compare margins, and look at what is inside them
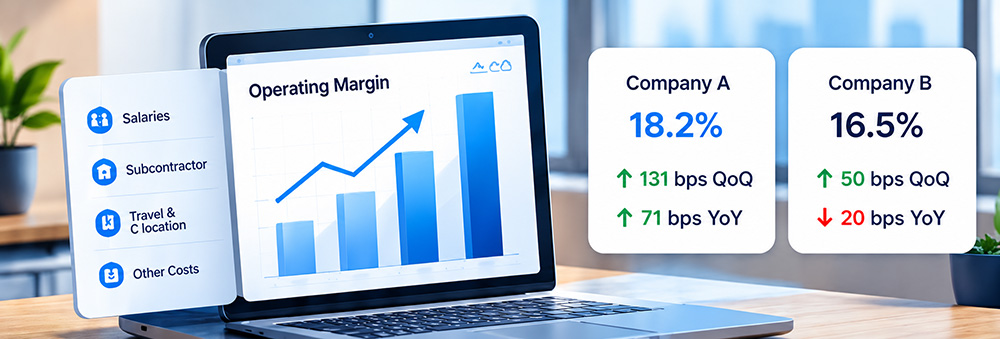
The operating margin, which IT companies report as EBIT margin or IT services operating margin, shows how much of each rupee of revenue remains after the operating costs. For IT services, the main costs are salaries, subcontractor costs, travel and facilities, so margin tells you about pricing power, utilisation of people and cost control. Look at the margin change from the previous quarter and from the same quarter last year, and give more weight to the change than to the level, since companies define margin a little differently and the levels are not always comparable. Company A reported an EBIT margin of 18.2 percent, which was up 131 basis points from the previous quarter and 71 basis points from a year ago. Company B reported an IT services operating margin of 16.5 percent, which was up 0.5 percentage points from the previous quarter but down 0.2 percentage points from a year ago. Both companies improved over the previous quarter, but only Company A is also better than a year ago. A basis point is one hundredth of a percentage point, so 131 basis points means 1.31 percentage points.
Then ask what is inside the margin. A onetime cost or a onetime benefit can distort a quarter. Company A disclosed that restructuring costs reduced its margin by 84 basis points in this quarter, which means that the margin without this cost was higher, and that the cost may not come back. A margin that rises because of a lasting change, such as better pricing or higher utilisation, is more valuable than one that rises because of a temporary saving. Also remember that net profit is not the same as operating profit. Net profit is affected by other income, interest, tax and onetime items. The profit rise at Company A was helped by higher margins from its advanced AI work and by a lower tax outgo, and the profit growth of 21.2 percent is therefore much larger than the constant currency revenue growth of 2.6 percent. Company B reported a net income that fell 1.9 percent from a year ago. To understand such gaps, read the profit and loss account line by line, and check how much of the profit change came from operations and how much from tax and other items.
Step three: compare deal wins, but compare each company with itself
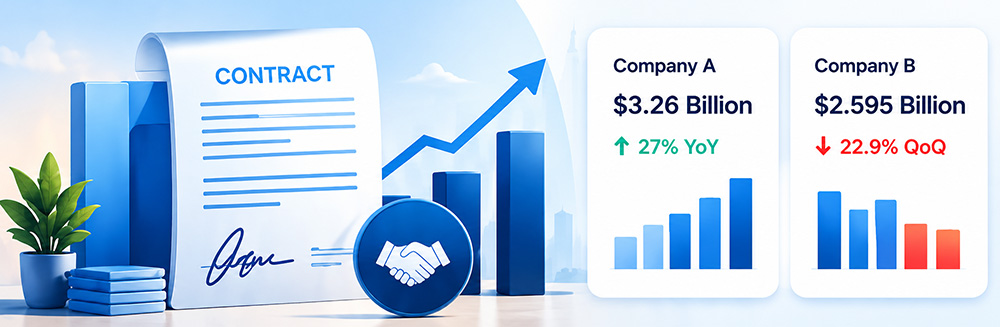
Deal wins show how much future work the company has signed. IT companies report total contract value, or TCV, of new deals, and many also report large deals, which are deals above a certain size. Company B counts a deal as large when its total contract value is 30 million dollars or more. Definitions differ between companies, so compare each company with its own history and not directly with a peer. Deal wins are also lumpy. One very large contract can make a quarter look excellent, and the lack of one can make the next quarter look weak, so look at the year on year change and at the last four to six quarters. Company A reported new deal wins of 3.3 billion dollars, up 27 percent from a year ago, with first half bookings at a record. Company B reported total bookings of 2.595 billion dollars, down 22.9 percent from the previous quarter, and large deal bookings of 674 million dollars, down 58.6 percent. The fall at Company B looks sharp, but remember that its large deal bookings in the previous quarter were 1.63 billion dollars, an unusually strong figure, so part of the fall comes from a high base.
A useful extra check is the book to bill ratio, which is the deal wins in a quarter divided by the revenue of the same quarter. A ratio above one means that the company is signing more work than it is delivering, and below one means the opposite. Using the figures above, Company A has a ratio of roughly 0.9 (3.26 billion dollars of bookings against about 3.72 billion dollars of revenue) and Company B has a ratio of roughly 1.0 (2.595 billion dollars against IT services revenue of 2.61 billion dollars). This is a rough calculation, because the two companies define bookings differently, but it shows why you should not judge a company by the percentage change in deal wins alone. Finally, remember that signing a deal is not the same as earning revenue. Large deals take several quarters to ramp up, so ask how fast the deal wins are turning into revenue.
Step four: read the guidance, and know what kind it is
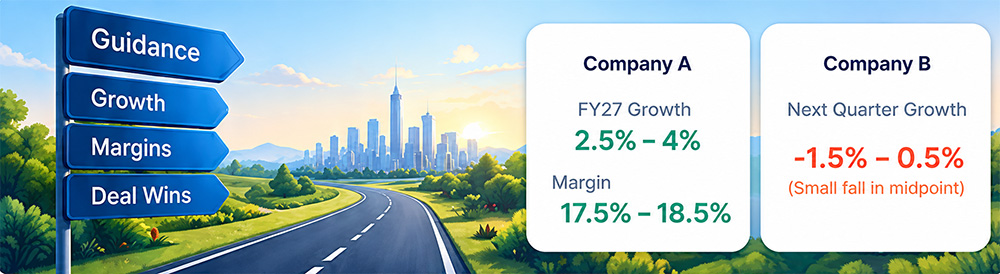
Guidance tells you what management expects next. Companies give it in different forms. Company A gave a full year guidance and raised the lower end of its range for constant currency revenue growth from 1 percent to 2.5 percent, while keeping the upper end at 4 percent, with its EBIT margin range of 17.5 to 18.5 percent unchanged. Company B gave a guidance for the next quarter only, with revenue expected to change between a fall of 1.5 percent and a rise of 0.5 percent in constant currency from the previous quarter. The midpoint of Company B guidance is a small fall, which tells you that management does not expect growth to return in the coming quarter. When you read guidance, check the direction of the change, the width of the range, the midpoint and whether the guidance fits the pace of the last few quarters. A higher lower end, as at Company A, usually shows more confidence, and a range with a negative midpoint, as at Company B, shows caution. Also look at the track record, which means whether management met its earlier guidance in the last four quarters, and read the concall to understand the reasons for any change.
Putting the two side by side
| Measure | Company A | Company B |
|---|---|---|
| Revenue growth in rupees, year on year | 11.5 percent | 9.1 percent |
| Revenue growth in constant currency, year on year | 2.6 percent | 0.6 percent |
| Constant currency growth from previous quarter | 2.3 percent | Flat |
| Operating margin | 18.2 percent | 16.5 percent |
| Margin change | Up 131 bps QoQ, up 71 bps YoY | Up 50 bps QoQ, down 20 bps YoY |
| Net profit growth, year on year | Up 21.2 percent | Down 1.9 percent |
| Deal bookings in the quarter | 3.26 billion dollars, up 27 percent YoY | 2.595 billion dollars, down 22.9 percent QoQ |
| Book to bill, rough | About 0.9 | About 1.0 |
| Guidance | FY27 growth 2.5 to 4 percent, margin 17.5 to 18.5 percent | Next quarter minus 1.5 to plus 0.5 percent |
On these measures, Company A shows faster growth, a better margin trend, stronger deal wins and a firmer guidance, while Company B shows weaker growth and a cautious guidance. This is a comparison of reported numbers, and it is not a recommendation to buy or sell either stock. The numbers come from company releases and news reports, which can differ slightly from each other, so please check each figure in the exchange filing before you use it.
More checks that complete the picture
Cash conversion tells you whether profit is turning into cash. Company B reported operating cash flow of 165.8 percent of net income, which is a strong point in its favour, and it is worth checking the same ratio for any company you compare. Look at the share of newer businesses too. Company A reported advanced AI revenue of 219 million dollars, up 78 percent from a year ago in constant currency, against total quarterly revenue of 3.72 billion dollars. That is about 6 percent of revenue, so the growth rate is high but the base is still small. Also check the mix of clients and regions, the dependence on a few large clients, the headcount, attrition and utilisation, and the dividend. Finally, look at valuation, because the sector rose on the results and a better business can still be a poor purchase at a high price. Compare the price to earnings ratio of each company with its own history, with its peers and with its growth, and decide whether the price already reflects the good news.
A simple routine you can repeat every quarter
Make a one page sheet with the companies you follow as columns and the measures above as rows. Fill it from the press release and the investor presentation of each company, then compare each company with its own last four quarters before you compare it with its peers. Note which measures improved, which worsened and why, and then read the concall transcript to understand the reasons behind the numbers that look unusual. Do this after every results season, and keep the sheets. Over a few quarters, you will see which companies are improving steadily and which ones only look good in a single quarter.
Mistakes to avoid
The first mistake is to compare growth in rupees, since a weaker rupee makes every company look better. The second is to compare margin levels across companies without checking how each defines margin. The third is to judge deal wins from one quarter, because large deals are lumpy and a high base makes the next quarter look weak. The fourth is to ignore onetime items in margin and profit. The fifth is to buy the stock that rose the least in a sector rally in the belief that it will catch up, when it may be lagging for good reasons. The sixth is to forget that all IT stocks share the same risks, such as visa and labour rules, the effect of artificial intelligence on services work and weak global demand, so a good comparison does not remove the risk of the sector as a whole. This article is for education and is not a recommendation to buy or sell any stock, and every stock market investment carries risk.
A good comparison of IT companies after results rests on four questions. Is the growth real in constant currency and in which segments? Is the margin improving and is the improvement lasting? Are the deal wins strong relative to the revenue and to the company own history? And does the guidance show rising or falling confidence? Add cash conversion and valuation, and you have a fuller view than any headline can give. Two companies can look almost the same in rupee growth and still be very different businesses, which is why the comparison is worth doing.