
Tamilnad Mercantile Bank - IPO Note
Bank - Private
Tamilnad Mercantile Bank - IPO Note
Bank - Private
Stock Info
Shareholding (Pre IPO)
Shareholding (Post IPO)
Key Strengths & future growth strategies:
Strong presence in Tamil Nadu, with plans to expand into other strategic regions:
Since its inception, the company has built a strong and trustworthy customer base
in the state of Tamil Nadu. As of March 31, 2020, 2021, and 2022, their deposits
and advances in the state of Tamil Nadu accounted for 75.93%, 76.33%, and 75.06%
of their Total Business, respectively. As of March 31, 2022, the bank had 4.32 million
customers, accounting for 85.03% of their total customer base, who contributed to
their deposits and advances portfolios in Tamil Nadu.
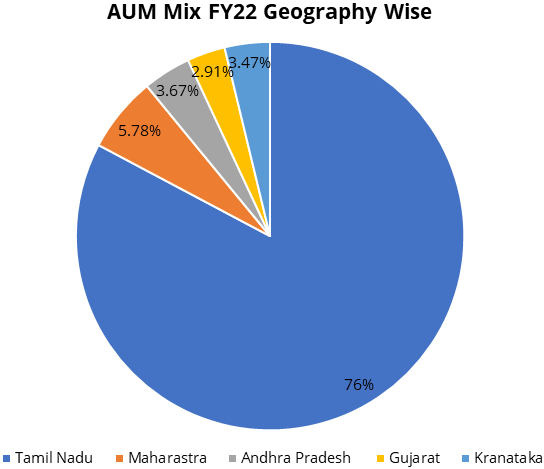
Apart from their home state, Tamil Nadu, TMB focuses on diversifying their reach in their already existing network including in the states of Gujarat, Maharashtra, Karnataka and Andhra Pradesh. As of March 31, 2022, their businesses, including the deposits and advances portfolios, in the state of Tamil Nadu, Maharashtra, Andhra Pradesh, Karnataka and Gujarat contributed 75.06%, 5.78%, 3.67%, 3.47% and 2.91% to their Total Business. The bank now intents to increase their markets share in these states.
Advances with focus on MSME, agricultural and retail segments:
They have traditionally focused on small ticket size loan products to MSME customers,
agricultural and retail customers for growth. They have dedicated marketing managers
and agri-officers across regional offices who specifically focus on growing the
network of existing MSME and agricultural customers. They leverage presence in semi-urban
and rural regions where they are located to attract more customers in the RAM segment.
RAM business has consistently increased over the last three Fiscals from Rs 231,427.36 million in Fiscal 2020 to Rs 295,205.01 million in Fiscal 2022 at a CAGR of 12.94%.
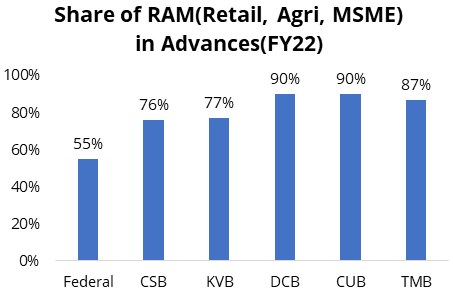
Advances to the RAM segment represent 88.14% of net advances as at March 31, 2022. Advances to MSME segment represented 37.38%, of total advances, as at March 31, 2022 of which 50.47% was towards traders and 39.26% was towards manufacturers. Further, advances for MSMEs in semi-urban regions of places where they are located has grown from Rs 43,546.72 million as of March 31, 2020 to Rs 50,156.45 million as of March 31, 2021 to Rs 53,530.71 million as of March 31, 2022 growing at 6.73% of overall advances and from Rs 11,633.58 million as of March 31, 2020 to Rs 13,603.76 million as of March 31, 2021 to Rs 14,720.74 million as of March 31, 2022, growing at 8.21% of overall advances in rural areas of places where they are located.
| Category of loan portfolio | Amount outstanding (₹ Crore) | % of Total Advances | Average ticket size (₹ Crore) |
|---|---|---|---|
| RAM customers | |||
| ‐ MSMEs | 12,615.19 | 37.38 | 0.19 |
| ‐ Agricultural customers | 10,022.85 | 29.70 | 0.01 |
| ‐ Retail customers | 6,882.46 | 20.39 | 0.05 |
| Corporate customers | 4,227.67 | 12.53 | 0.57 |
| Total | 33,748.17 | 100 | 0.03 |
| Parameter | MSMEs | Agricultural Customers | Retail Customers | Corporate Customers |
|---|---|---|---|---|
| FY22 Portfolio Size (₹ Crore) | 10,706 ‐12,615 | 6,995 – 10,023 | 5,442 – 6,882 | 5,093 – 4,228 |
| CAGR (FY20‐FY22) | 8.55% | 19.70% | 12.46% | 12.46% |
| Average Ticket Size (₹ Millions) | 1.89 | 0.13 | 0.47 | 5.67 |
| % of Total Advances | 37.38% | 29.70% | 20.39% | 12.53% |
Company's granular loan book has resulted in high NIMs and return ratios.
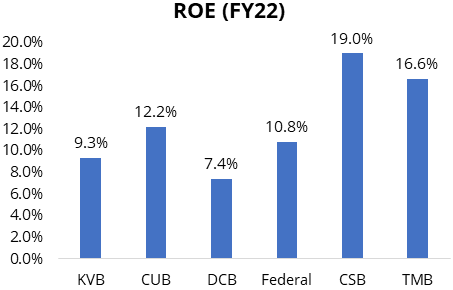
TMB has traditionally focused on small ticket size loan products to MSME (37% mix),
agricultural (30% mix) and retail (20% mix) customers for its growth. TMB's
focus is on understanding its customers' needs and expectations, particularly
in the RAM (Retail, Agri, MSME) space, and on developing strategies to target these
customer segments for growth.
TMB uses its presence in semi-urban and rural areas where it operates to attract more RAM customers. TMB has dedicated branches in Thoothukudi and Chennai, Tamil Nadu, and Surat, Gujarat, to serve the needs of MSME customers in these areas.
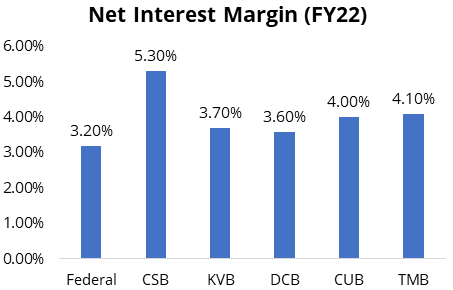
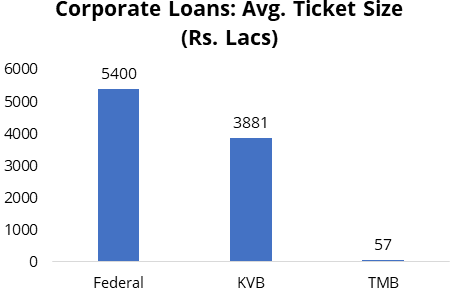
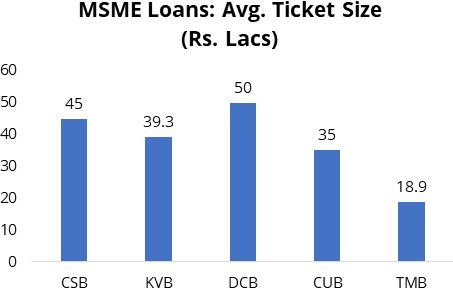
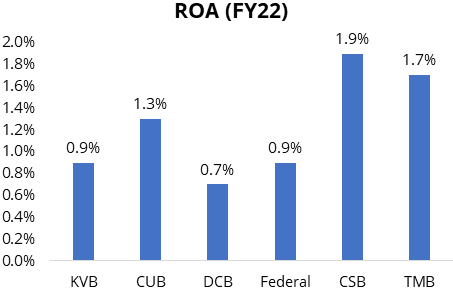
Furthermore, these dedicated branches serve as MSME customer facilitators, with a focus on improving loan processing timelines and faster disbursals to benefit MSME customers. TMB's targeted granular approach (lowest average ticket size among all peer banks) has resulted in superior NIMs of 4.1%.
Superior asset quality
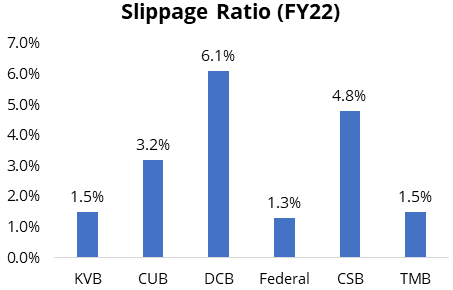
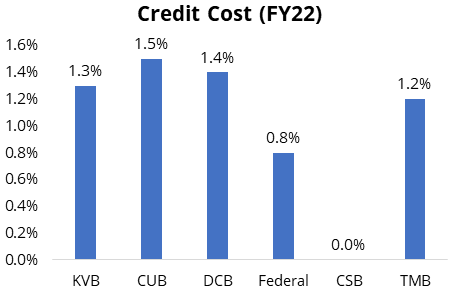
Company focuses on selective lending and limits its exposure to certain industries
and sectors as a part of its strategy to monitor concentration risk. Company’s
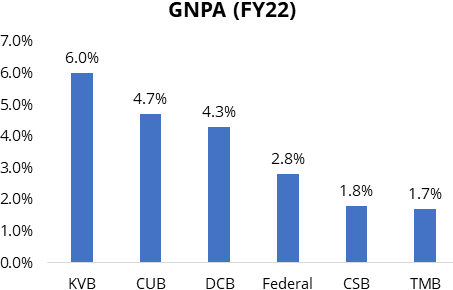
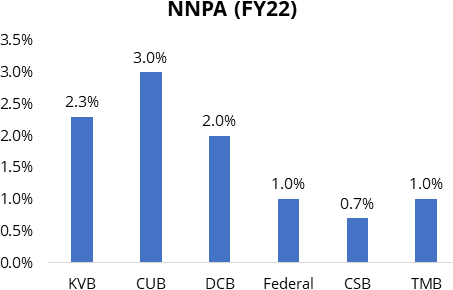
GNPA has reduced from 3.6% in FY20 to 1.7% in FY22, lower compared to peers. GNPA
in RAM portfolio stands at 1.45% while in corporate portfolio stands at 3.36%. NNPA
has also reduced from 1.80% in FY20 to 0.95% in FY22.
Industry
Peer comparison
| Parameters (FY22) | Tamilnad Mercantile Bank | City Union Bank | Catholic Syrian Bank | DCB | Federal Bank | Karur Vysya Bank | Karnataka Bank | RBL Bank | South Indian Bank |
|---|---|---|---|---|---|---|---|---|---|
| Tamilnad Mercantile Bank | City Union Bank | Catholic Syrian Bank | Federal Bank | Karur Vysya Bank | Karnataka Bank | South | |||
| Parameters (FY22) | DCB | RBL Bank | Indian Bank | ||||||
| Advances (Rs. cr) | 33492.00 | 40359.00 | 15815.00 | 29096.00 | 144928.00 | 55335.00 | 56783.00 | 60022.00 | 59993.00 |
| Advances CAGR (FY20-22) | 9.90% | 9.10% | 18.00% | 7.10% | 8.90% | 9.60% | -0.20% | 1.70% | -3.50% |
| Deposits (CAGR FY20-22) | 10.50% | 8.10% | 13.10% | 6.90% | 9.20% | 7.80% | 5.80% | 16.90% | 3.60% |
| Net Profit (Rs. cr) | 822.00 | 760.00 | 458.00 | 288.00 | 1890.00 | 673.00 | 509.00 | -75.00 | 45.00 |
| CASA / Total Deposit (%) | 30.50% | 32.60% | 33.70% | 26.80% | 36.90% | 34.80% | 33.00% | 35.30% | 33.20% |
| Yield on Advances (%) | 9.50% | 9.40% | 11.20% | 10.70% | 7.90% | 8.50% | 8.80% | 12.20% | 8.70% |
| Cost of Deposits (%) | 4.90% | 4.68% | 4.31% | 6.05% | 4.28% | 4.30% | 4.66% | 4.81% | 4.75% |
| NIM (%) | 4.10% | 3.98% | 5.27% | 3.56% | 3.16% | 3.69% | 3.18% | 4.40% | 2.62% |
| RoE (%) | 16.60% | 12.23% | 18.98% | 7.37% | 10.82% | 9.25% | 7.40% | -0.59% | 0.77% |
| Gross NPA (Rs. cr) | 571.00 | 1933.00 | 290.00 | 1290.00 | 4137.00 | 3431.00 | 2251.00 | 2728.00 | 3648.00 |
| Gross NPA (%) | 1.70% | 4.70% | 1.80% | 4.30% | 2.80% | 6.00% | 3.90% | 4.40% | 5.90% |
| Net NPA (%) | 1.00% | 3.00% | 0.70% | 2.00% | 1.00% | 2.30% | 2.40% | 1.30% | 3.00% |
| Book Value | 374.40 | 89.10 | 152.80 | 130.20 | 91.60 | 95.00 | 228.00 | 209.00 | 28.00 |
| Market Cap (Rs. cr) | 8314.00 | 13390.00 | 3664.00 | 2930.00 | 25002.00 | 5682.00 | 2327.00 | 7323.00 | 1716.00 |
| P/BV (x) | 1.40 | 2.00 | 1.40 | 0.70 | 1.30 | 0.70 | 0.30 | 0.60 | 0.30 |
Risks
Competition with Fintech firms:
Private sector banks are currently facing fierce completion from fintech players.
Asset quality pain in new loans:
Any unexpected change in the economic outlook can lead to large slippages, even
in new loans.
Ongoing legal proceedings pending at various forums:
Total 37.7% of banks paid up equity share capital or 5.376 crore equity shares are
subject to outstanding legal proceedings, which are pending at various forums and,
in connection with which, proceedings against bank have been initiated by various
regulatory authorities, including RBI, Directorate of Enforcement, some of whom
have imposed and sought to impose penalties on the bank in the past. The bank cannot
assure that these matters will be resolved in a timely manner or at all and any
adverse developments in such proceedings could result in the imposition of injunctions
or penalties or requirement to incur significant costs to contest any of which could
have a material impact on the reputation, business, financial condition and results
of operation.
Exposure to risks arising from the dispute over ownership:
The ownership dispute has carried on for the last several years. Despite the fact
that the board approved the IPO, the prolonged adjudication of cases related to
this dispute is a constraint. As a result, issues concerning the bank's shareholding
and ownership will continue to be closely monitored.
Company Description
Tamilnad Mercantile Bank Limited (TMBL) is one of the oldest and leading old private sector banks in India with a history of almost 100 years. It offers a wide range of banking and financial services primarily to micro, small and medium enterprises (“MSME”), agricultural and retail customers (“RAM”). As of March 31, 2022, it has 509 branches, of which 106 branches are in rural, 247 in semi-urban, 80 in urban and 76 in metropolitan centres.
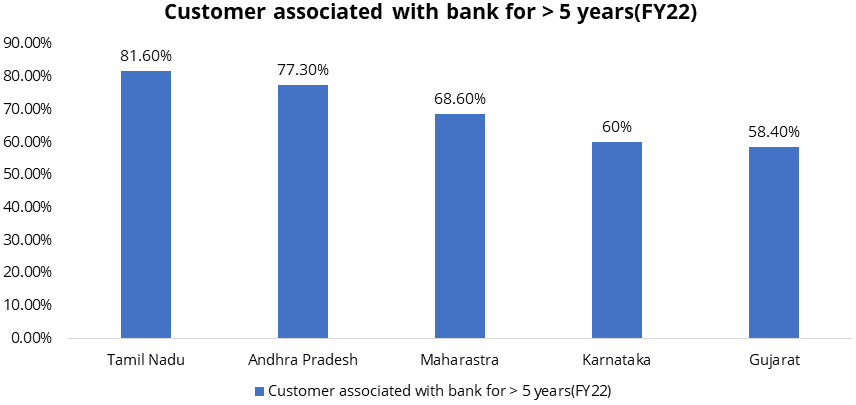
Its overall customer base is approximately 5.08 million as of March 31, 2022 and 4.05 million or 79.78% of its customers have been associated with it for a period of more than five years and have contributed to Rs. 350,142.39 million or 77.93% to its deposits and Rs. 219,022.26 million or 64.90% to its advances portfolios as of March 2022.
TMB has built a strong presence in the state of Tamil Nadu, with 369 branches and 949 automated teller machines (“ATMs”) and 255 cash recycler machines (“CRMs”), 91 E‐Lobbies, 3,939 PoS as of March 31, 2022.
Valuation
Tamilnad Mercantile bank ltd is old and leading bank with history of 100 years with sound financial performance across all parameters. The Bank is well capitalized with tier 1 capital adequacy ratio of 20.44%. They are majorly investing in tech-nology space so as to improve the customer experience. The Bank has good underwriting skills with strict pre-disbursement procedure for loans above 3 crores.
Deposits and Advance CAGR FY20-22 grew by 10.46% and 9.93% better than peers. Net profit also grew by 41.99% CAGR FY20-22 which is better than peers. On valuation front, it is available at P/ABV of 1.5x as on FY2022 which appears attractive as compared to industry peers. Thus, we recommend to subscribe the issue.
Key Information
Use of Proceeds:
Book running lead managers:
The offer comprises fresh issue of 1.58Cr equity shares to raise Rs.831.60 cr.
- To augment the bank’s Tier – 1 capital base to meet the future capital requirements.
- To receive the benefits of listing the shares on the stock exchanges.
Management:
K V Rama Moorthy: MD & CEO, Niranjan Sankar A is the Non‐Executive Director, S R
Ashok is the Non‐Executive Director
Financial Statement
Profit & Loss Statement:- (Consolidated)
| Particulars (Rs in million) | FY22 | FY21 | FY20 |
|---|---|---|---|
| INCOME | |||
| Interest earned | 38338.60 | 36090.50 | 34661.10 |
| Other Income | 8225.80 | 6443.50 | 5264.20 |
| TOTAL | 46564.40 | 42534.00 | 39925.30 |
| EXPENDITURE | |||
| Interest Expended | 20186.30 | 20715.30 | 21465.90 |
| Operating Expenses | 11110.40 | 9796.50 | 8509.10 |
| Provisions & Contingencies | 7048.60 | 5988.90 | 5873.30 |
| TOTAL | 38345.30 | 36500.70 | 35848.40 |
| Net Profit for the year | 8219.10 | 6033.30 | 4076.90 |
| EPS | 57.70 | 42.30 | 28.60 |
| FV | 10.00 | 10.00 | 10.00 |