Sula Vineyards Limited - IPO Note
Miscellaneous
Sula Vineyards Limited - IPO Note
Miscellaneous
Stock Info
Shareholding (Pre IPO)
Shareholding (Post IPO)
Company Description
Company overview
Sula Vineyards Limited was incorporated on 26th February, 2003. Sula
is India’s largest wine producer and seller as of March 31, 2022. The company
has witnessed growth consistently and established itself as the market leader in
the Indian wine industry in terms of sales volume and revenue. Sula is also recognized
as the market leader across wine variants, including red, white and sparkling wines.
Sula’s Shiraz Cabernet is India’s largest selling wine by value in Fiscal
2021. The gross billings of Sula Shiraz Cabernet in FY22 amounted to Rs 91.83 crore.
Company’s business can broadly classified under 2 categories (i) the production,
distribution and imports of wine, and (ii) the sale of services from ownership and
operation of Wine Tourism Business, including vineyard resorts and tasting rooms.
Manufacturing Facilities
Sula produces 56 different labels of wine at 4 owned and 2 leased production facilities
located in the Indian states of Maharashtra and Karnataka.
| Location | H1 FY23 | FY22 | FY21 | FY20 | ||||
|---|---|---|---|---|---|---|---|---|
| Installed capacity | Capacity utilization | Installed capacity | Capacity utilization | Installed capacity | Capacity utilization | Installed capacity | Capacity utilization | |
| Maharashtra | ||||||||
| Nashik winery | 46.4 | 22.44 | 46.4 | 36.79 | 45.71 | 29 | 45.4 | 27.37 |
| Domaine winery | 66.21 | 36.91 | 66.21 | 52.61 | 66.21 | 49.2 | 66.2 | 45.87 |
| Leased winery 1 | 9.94 | 5.74 | 9.94 | 8.94 | 9.94 | 7.68 | 9.94 | 6.92 |
| York winery (ASPL) | 4.84 | 3.44 | 4.84 | 3.96 | 0 | 0 | 0 | 0 |
| Total Maharashtra | 127.39 | 68.54 | 127.39 | 102.29 | 121.85 | 85.9 | 122 | 80.16 |
| Karnataka | ||||||||
| Domaine sula (DS) | 11.39 | 8.47 | 11.39 | 9.22 | 11.36 | 8.14 | 11.2 | 7.66 |
| Leased winery 2 | 6.62 | 4.83 | 6.62 | 3.99 | 6.62 | 3.1 | 6.75 | 2.93 |
| Total Karnataka | 18.01 | 13.31 | 18.01 | 13.21 | 17.98 | 11.2 | 18 | 10.59 |
| TOTAL | 145.4 | 81.84 | 145.4 | 115.5 | 139.83 | 97.1 | 139 | 90.76 |
Source: Company RHP
Products of the company
Still wine: Wine that is neither sparkling nor fortified. Still
wine constituted 85.38 per cent. of Sula’s total production as of September
30, 2022 under the three main categories~ Elite, premium & economy and popular
category, 15, 22 and 9 labels respectively.
Sparkling wine: Wine that contains bubbles from dissolved carbon dioxide. Sparkling wine constituted 14.62 per cent. of its total production as of September 30, 2022 with 6 and 2 labels under the Elite and Premium & Economy category respectively.

Source: Company RHP
- High Barriers to entry
Wine making is a long period process which requires- Heavy investments for development of vineyards.
- Relationships with farmers.
- The wine business has a high inventory compared to other alcoholic beverages. The wine industry has one raw material production cycle and its harvesting season is from December to April. Wine storage and ageing happens throughout the year.
- Since the inventory days are high it results in higher working capital.
- The long gestation period from initiation to final product creates an entry barrier for new players.
- Branding – both direct and indirect advertising of alcohol is prohibited in India, and it can be advertised only at point of sale.
- High regulations industry in terms of taxes, imports and other compliance requirements.
- Established market leader in the Indian wine industry with the leading brand~
“Sula”
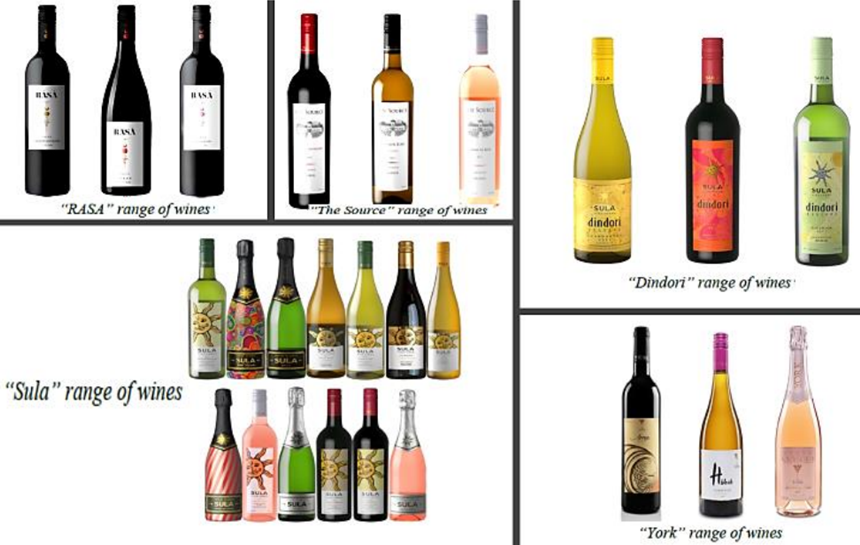
Since its incorporation the company has established itself as a strong player into the wines industry. The company is functional under the brand name “Sula”. In addition to Sula the company also own “Dindori”, “York”, “Satori”, “Mosiac”, “Madera”, “Samara” and “Dia” . The firm has consistently witnessed growth of 33% to 100% to 52% in revenue and volume terms respectively. The ‘Premium’ and ‘Elite’ wine categories contributed approximately 61%. by value and 40% by volume. - Strong distribution network
The company’s products are available at various platforms such as traditional retail stores, licensed alcohol stores, restaurants & bars. The company has presence in 25 states and 6 union territories as of 30th September 2022. In overseas market the company has presence in 20 countries. It has access to more than 23,000 points of sale (including over 13,500 retail touchpoints and over 9,000 hotels, restaurants and caterers) as of March 31, 2022, - Smooth raw material supply
Maharashtra and Karnataka are the top wine producing states in the country because of there favourable weather conditions for grape harvesting. These states are also the largest consumers of wine. Sula has entered into long-term supply agreements of up to 12 years with contract farmers for approximately 2,290 acres as of 30th September, 2022. Such long-term supply arrangements cover more than 90 per cent. of company’s annual supply of grapes. - Growth Opportunity
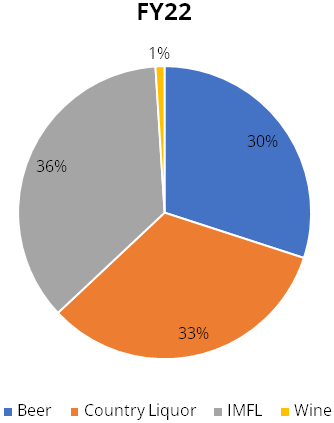
India is predominantly a spirits’ market with more than 90% of alcohol consumed in the form of spirits. India’s per capita consumption for wine is less than 100 ml. The contribution of wine to overall alcohol consumption in India is less than 1% against the world average of close to 13%. Consumption of wine is higher in developed countries which is close to 30%.
| Alcohol consumption | FY22 |
|---|---|
| Beer | 30% |
| Country Liquor | 33% |
| IMFL | 36% |
| Wine | 1% |

Sula’s Wine Tourism Business
Sula’s wine tourism business is famous for visits at its own developed vineyards
located in Nasik, Maharashtra. The vineyards give tourist an experience of wine
tasting, observing the process of wine making and staycation. The tourism business
of the company has helped the company in its brand strengthening and marketing all
over the world.
Key Operational Parameters of Wine Tourism Business
| Parameters | H1 FY23 | FY22 | FY21 | FY20 |
|---|---|---|---|---|
| Average Rooms Occupancy (%) | 77.37% | 70.97% | 43.66% | 66.48% |
| Average Room Revenue (ARR) (in Rs) | 10195 | 10367 | 9044 | 8759 |
| Room Revenue | ||||
| (A) Room Revenue (in Rs Crores) | 9.5 | 17 | 8.79 | 9.33 |
| Room Revenue to Total Income (%) | 4.22% | 3.72% | 2.09% | 1.73% |
| Food & Beverage, Merchandise, other Ancillary Services and Wine & Liquor | ||||
| (B) Sale of Food & Beverage, merchandise and all other ancillary services (₹ in millions) | 10.27 | 17.6 | 9.34 | 18.8 |
| C) Sale of Wine and Liquor (in Rs Crores) | 15.7 | 24.2 | 13.9 | 18.9 |
| Total Income (A + B + C) (in Rs Crores) | 35.5 | 58.8 | 32.1 | 47.1 |
Peer Comparison
Count of Labels
| Wine segments | Price range (INR) | Sula Vineyards | Grover Zampa | Fratelli |
|---|---|---|---|---|
| Elite | 950+ | 21 | 12 | 8 |
| Premium | 700-950 | 13 | 13 | 11 |
| Economy | 400-700 | 13 | 8 | 4 |
| Popular | <400 | 9 | 2 | 3 |
| Company Name | Inventory days | Acreage FY22 | Installed Capacity (000 Litre's) |
|---|---|---|---|
| Sula Vineyards Ltd. | 524.00 | 2521.00 | 13983.00 |
| Fratelli Wines | - | 240.00 | 1400.00 |
| Grover Zampa Pvt. Ltd. | - | 460.00 | 4700.00 |
Risks
- OFS: Current offer of shares is purely an Offer for Sale which means no proceeds of this issue will be available to company. All fund raised will go to selling shareholders
- Licensing and Regulation concerns: Wine industry is subject to a licensing and excise regulations.
- Heavy dependence on climatic conditions: Adverse climatic conditions leads to deterioration in quality of wine grapes which are Sula’s key raw materials.
- Young domestic Wine industry: The Indian wine market is relatively young, facing challenges at various stages mainly on account of consumption of alcohol and spirits.
- Lower penetration: Currently, India is Not a wine drinking nation. Category needs to be developed which can take long time.
Valuation
Sula Vineyards Limited is the largest producer and seller of wines in India. The company is a pioneer of wine products in domestic market and it is a consistent performer in terms of sales and volumes in wines industry. The firm has gained market share in terms of revenue from operations from 33% in FY 2009 to 52% in FY22. For upcoming years FY22-25 the growth opportunities in domestic wine industry are estimated to increase at a CAGR of 22%. The firm operates in a ‘High Barriers to entry’ industry which gives an added advantage to the company to grow its market share dominantly. At upper band IPO price of Rs 357/ share asking valuation is 52.57x of its FY22 earnings looks reasonable incomparison to other beverage companies with PE valuation of 119.83x and 76.14x of United Breweries Ltd. and United spirits Ltd. respectively.
We recommend ‘SUBSCRIBE’ to the IPO offer for listing gains and long term investments.
| Valuation | FY 22 |
|---|---|
| PE (x) | 52.57 |
| Debt/ Equity (x) | 0.58 |
| ROE (%) | 11.60% |
| ROCE (%) | 18.30% |
| Inventory days | 524 |
| Cash Conversion Cycle (days) | 347 |
| Days Payable Outstanding (days) | 200 |
| Net Working Capital Days (days) | 65 |
Key Information
Use of Proceeds:
The offer is purely an ‘Offer for Sale’ of up to 26,900,530 Equity Shares
by the Selling Shareholders and the company intends to garner Rs 960 cr from this
issue.
Achieve the benefits of listing the Equity Shares on the Stock Exchanges. Since the offer is an ‘Offer for Sale’ the company will not receive any proceeds from the Offer and all such proceeds (net of any Offer related expenses to be borne by the Selling Shareholders) will go to the Selling Shareholders.
Book running lead managers:
Kotak Mahindra Capital Company Limited, CLSA India Private Limited, IIFL Securities
Limite
Management:
Chetan Rameshchandra Desai (Chairman and Non-Executive Independent Director ), Rajeev
Samant (Promoter, Managing Director, Chief Executive Officer)
Financial Statement
Profit & Loss Statement:- (Consolidated)
| Particulars | H1 FY23 | FY22 | FY21 | FY20 |
|---|---|---|---|---|
| Equity share capital | 16.32 | 15.72 | 15.08 | 15.04 |
| Reserves | 432.87 | 379.54 | 289.66 | 284.90 |
| Net worth | 449.19 | 395.26 | 304.74 | 299.95 |
| Revenue from operations | 224.07 | 453.92 | 417.96 | 521.63 |
| Revenue growth (%) | 40.79% | 8.60% | -19.87% | - |
| EBITDA | 64.31 | 116.07 | 64.51 | 50.49 |
| EBITDA margin (%) | 28.70% | 25.57% | 15.44% | 9.68% |
| Profit before tax | 41.26 | 69.54 | 3.19 | -17.40 |
| Profit after tax (PAT) | 30.51 | 52.14 | 3.01 | -15.94 |
| PAT (%) | 13.61% | 11.49% | 0.72% | -3.06% |
| EPS- Basic & Diluted | 3.76 | 6.79 | 0.40 | -2.09 |
| RNONW (%) | 6.79% | 13.19% | 0.98% | -5.23% |