KFin Technologies Limited - IPO Note
Miscellaneous
KFin Technologies Limited - IPO Note
Miscellaneous
Stock Info
Shareholding (Pre IPO)
Shareholding (Post IPO)
Company Description
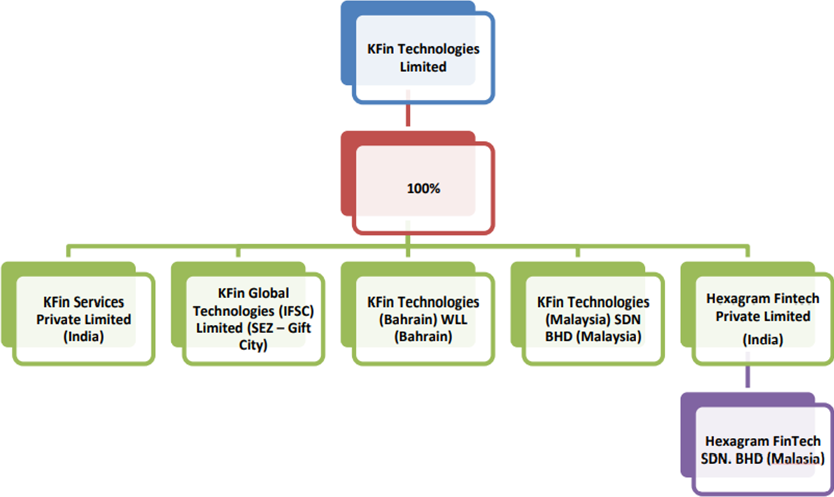
KFintech Technologies Limited was incorporated on 8th June, 2017 as demerged entity from erstwhile Karvy Financials. KFintech is a leading technology driven financial services platform, providing comprehensive services and solutions to the capital markets ecosystem including asset managers and corporate issuers across asset classes in India and provide several investor solutions including transaction origination and processing for mutual funds and private retirement schemes. As on 30th September, 2022, KFintech is India’s largest investor solutions provider to Indian mutual funds, based on number of AMC clients serviced. They are providing services to 24 out of 41 AMCs in India. As on September 30, 2022, they are the only investor and issuer solutions provider in India that offers services to asset managers such as mutual funds, alternative investment funds, wealth managers and pension as well as corporate issuers in India, besides servicing overseas clients in Hong-Kong, Malaysia and Philippines. The company services 301 funds of 192 asset managers in India and represent 30% market share based on Alternative Investment Funds serviced.

Source: Company RHP
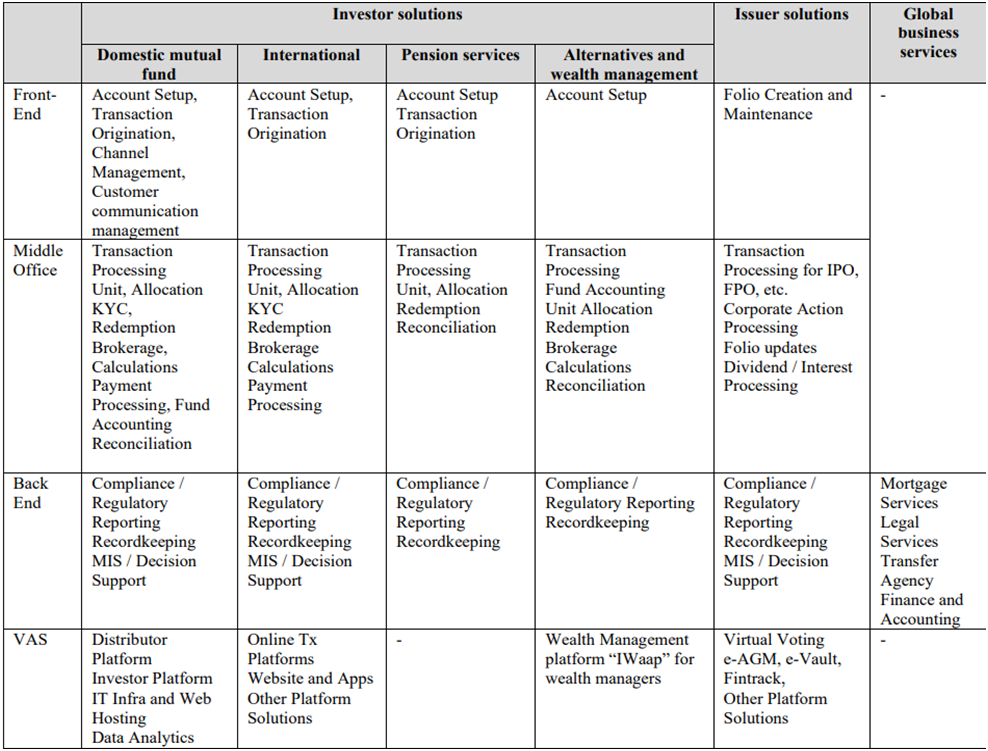
Products of the company

Source: Company RHP
Platform with strong track record of growth and market leadership
KFintech is a leading technology driven financial services platform providing comprehensive
services and solutions to capital markets ecosystem including asset managers and
corporate issuers across asset classes in India. Additionally, the company also
provide several investor solutions including transaction origination and processing
for mutual funds and private retirement schemes in Malaysia, Philippines and Hong
Kong. The company provides services to 24 out of 41 AMCs in India, (as on September
30, 2022) representing 59% of market share based on the number of AMC clients (as
per RHP). They have on-boarded seven (including two AMCs that are yet to launch
operations) of the last 11 new AMCs in India (including one AMC that has not yet
appointed a registrar and transfer agent for their operations) for domestic mutual
fund solutions. As on September 30, 2022, KFIN has also on-boarded 15 of the last
21 mutual funds launched in India. Further, within investor solutions for Indian
mutual funds, they had a market share of 32% based on overall AAUM managed by their
clients and serviced by them during September, 2022.
Revenue from Operations in various Categories
| Category (in Rs Crores) | H1 FY23 | FY22 | FY21 | FY20 |
|---|---|---|---|---|
| Investor solution | ||||
| Domestic mutual fund | 236 | 451 | 317 | 280 |
| International and other investor solution | 30 | 48 | 38 | 31 |
| Issuer solutions | 46.6 | 74 | 62 | 51 |
| Global business services | 23 | 42 | 42 | 36 |
| Revenue from operations | 349 | 640 | 481 | 450 |
Source: Company RHP
Asset-light business model with recurring revenue, high operating leverage, profitability and cash generation KFIN operates an attractive business model with a demonstrated track record of consistent profitability and returns. The management believe their business operations are highly resilient and predictable to a large extent due to deep client entrenchment and largely recurring nature of revenues. The company asset turnover ratio was 3.20x and 2.57x in FY22 and H1 FY23 (on an annualized basis), respectively. They undertook a buyback of 14,987,846 Equity Shares in FY22. In addition, they repair their outstanding borrowings aggregating to Rs 400 Crores along with interest payments by December 31, 2021. KFIN return on capital deployed and return on equity during H1 FY23 is 20.71% and 24.72%, respectively (on an annualized basis).
Long-standing client relationships with a diversified and expanding client base
In India, the investor solutions business that the Company operates in typically
has two to three players, as it requires high technology intensity and a track record
of delivery at scale, and are subject to stringent compliance and regulations, resulting
in high barriers to entry for any new entrant (as per RHP). The company has been
able to retain a large proportion of its clients across its businesses. KFin has
never lost an AMC or MF client over the last three fiscals and H1 FY23 to competition
except where its client had been acquired by another AMC that was not its client
or where its client had ceased operations. Also, the Company’s issuer solutions
business, client loss is minimal and primarily restricted to merger and acquisitions
and other corporate changes. Sale of services from entities that have been clients
for more than five years constituted 79.80% of its total income in H1 FY23.
Revenue Contribution by Top five clients in each segment & years of client relationship
| Business | Top five clients | Revenue contributed by top five clients as a % of revenue from operations as of September 30, 2022 | Duration of relationship / association (in years) |
|---|---|---|---|
| Investor solutions | |||
| Domestic mutual fund solutions | Nippon Life AMC | 24 | |
| UTI AMC | 13 | ||
| Axis MC | 49.30% | 12 | |
| Mirrae AMC | 14 | ||
| Customer A | 11 | ||
| International investor solutions | BPI Investment management | 6 | |
| Customer A | 6 | ||
| Customer B | 2.50% | 3 | |
| Customer C | 2 | ||
| Customer D | 12 | ||
| Issuer solutions | RIL | 2.40% | 17 |
| Infosys | 13 | ||
| HUL | 17 | ||
| Customer E | 12 | ||
| Customer F | 1 | ||
| Global business services | Computer share | 6.40% | 8 |
Source: Company RHP
Unique “platform-as-a-service” model provides comprehensive end-to-end
solutions enabled by technology solutions
The “platform-as-a-service” business model of the company provides its
clients with comprehensive end-to-end solutions. The technology offering of company
enables transaction lifecycle management combined with highly secure data collection,
processing and storage. It has an integrated system of data centers which houses
over 350 servers and data storage handling capacity of over 250 TB. They provide
the flexibility of addressing all major asset classes for asset managers and corporate
clients through its platform. The Company has launched over 20 new products over
the last three Fiscals and six months ended September30, 2022, with two products
in the pipeline. Further, it can onboard a client and customize its platform for
their requirements and enable them to launch their business with quick turnaround
times. KFin continues to automate processes and enhance its systems and risk management
to ensure that all its obligations and regulatory requirements are completed on
a timely basis. Its systems and infra -availability stands at 99.99% accuracy. Its
10 gigabyte enhanced intranet ensures data transactions to be processed with no
latency.
Revenue contribution on the basis of services
| Business | H1 FY23 | FY22 | FY21 | FY20 | ||||
|---|---|---|---|---|---|---|---|---|
| in Crores | (as % of revenue from operations) | in Crores | (as % of revenue from operations) | in Crores | (as % of revenue from operations) | in Crores | (as % of revenue from operations) | |
| Core services (Fees and other operating revenue) | 330.19 | 94.68% | 600.8 | 96.96% | 453.5 | 94.27% | 432.12 | 96% |
| VAS | 18.5 | 5.32% | 38.6 | 6.04% | 27.5 | 5.73% | 17.74 | 3.95% |
Source: Company RHP
Peer Comparison
| Companies | Total revenues (crores) | EBITDA % | PAT% | EPS | PE | RoNW% |
|---|---|---|---|---|---|---|
| Kfintech Technologies Ltd. | 639.51 | 45.50% | 23.00% | 9.44 | 38.77 | 29.99 |
| Computer management services ltd. | 909.67 | 47.60% | 31.00% | 58.73 | 39.37 | 49.32 |
Risks
- The company’s erstwhile promoters are subject to ongoing investigations by enforcement agencies, and the outcome of such investigations may adversely impact the company and the market price of their Equity Shares.
- They are subject to extensive government regulation
- The company is subject to periodic inspections by SEBI and PFRDA, pursuant to their registration as an RTA and CRA, respectively.
- A decline in the growth, value and composition of AAUM of the mutual funds managed by its clients may adversely impact the average revenue earned by them from mutual funds and may have a significant adverse impact on future revenue and profit.
- Competition could negatively affect the company ability to maintain or increase its market share and profitability.
Valuation
Kfintech Technologies Ltd. has witnessed a good growth in its revenues in past two years. It is the only company to compete against CAMS in this space. The company’s business model is asset light and major part of its revenues are derived from mutual funds solutions and issuer solutions. But company is facing certain regulatory litigations which may impact the business severely. Although we have positive view on the company’s business , we highlight few pertinent issues which may remain an overhang on stock’s performance in future.
Issues faced by the company (in our opinion)
- erstwhile promoter still holds 14% in co which is currently pledged with lenders
- Valuation: The issue is priced to perfection leaving very little for subscribers to IPO. At offer price of Rs 366 the issue is priced at 39x its FY22 earnings which is almost equal to its peer (CAMS). We believe this offer price is expensive given the earnings level it has currently incomparison to its peers CAMS.
- Entire issue is an OFS, this means nothing comes to the company.
- Also, the promoter is an investor who will ultimately exit fully at some point in time. That means overhang of seller.
Recommendation: At this point we recommend AVOID this issue if in future the stock is available t favourable risk reward, we will reassess to enter into it.
Key Information
Use of Proceeds:
- The offer is purely an ‘Offer for Sale’ of up to 40,983,606 Equity Shares by the Selling Shareholders and the company intends to garner Rs 1500 cr from this issue.
- Achieve the benefits of listing the Equity Shares on the Stock Exchanges. Since the offer is an ‘Offer for Sale’ the company will not receive any proceeds from the Offer and all such proceeds (net of any Offer related expenses to be borne by the Selling Shareholders) will go to the Selling Shareholders.
Book running lead managers:
ICICI Securities, Kotak Mahindra Capital, J.P.Morgan India, IIFL Securities, Jefferies
India
Management:
Vishwanathan Mavila Nair (Chairman and Non-executive Director), Venkata Satya Naga
Sreekanth Nadella (Managing Director & CEO)
Financial Statement
Profit & Loss Statement:- (Consolidated)
| Particulars | H1 FY23 | FY22 | FY21 | FY20 |
|---|---|---|---|---|
| Equity share capital | 167.57 | 167.57 | 150.84 | 150.84 |
| Reserves | 569.15 | 476.77 | 195.56 | 258.73 |
| Revenue from operations | 348.77 | 639.51 | 481.14 | 449.87 |
| Reveneue Growth (%) | 19.89% | 32.92% | 6.95% | |
| EBITDA | 138.50 | 293.91 | 217.45 | 164.02 |
| EBITDA margin (%) | 39.15% | 45.53% | 44.72% | 36.03% |
| Profit before tax | 110.66 | 204.00 | 67.51 | 18.51 |
| Net profit | 85.35 | 148.55 | -64.51 | 4.52 |
| Net profit margin (%) | 24.47% | 23.23% | -13.41% | 1.01% |
| EPS- Basic | 5.09 | 9.44 | -4.28 | 0.28 |
| EPS- Diluted | 5.05 | 9.36 | -4.28 | 0.28 |
| RONW (%) | 12.36% | 29.99% | -17.07% | 0.97% |