Five Star Business Finance Limited - IPO Note
Finance - NBFC
Five Star Business Finance Limited - IPO Note
Finance - NBFC
Stock Info
Shareholding (Pre IPO)
Shareholding (Post IPO)
Company Description
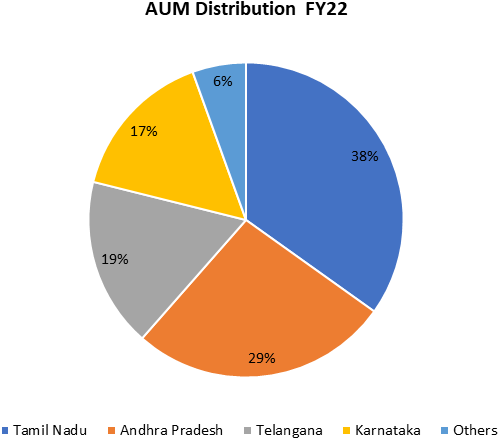
Five star business incorporated on 7th May 1984. It is an NBFC-ND-SI engaged in the business of providing secured loans to micro- entrepreneurs and self-employed individuals for business purposes, asset creation and to meet personal requirements. The company has a dominant presence in South India and is headquartered in Chennai, Tamil Nadu. The company has a vast network of 311 branches as of 30th June 2022 spread across 150 districts, 8 states, and 1 union territory with Tamil Nadu, Andhra Pradesh, Telangana and Karnataka as the major states. As per RHP the company is ranked 3rd among other NBFC’s in India for gross non-performing assets (stage 3 gross term loans which are 90+ days – past due), as percentage of Gross Term Loans stand at 1.05% as at 31st March 2022. Company targets its customers in Urban and Semi-Urban locations along with Rural markets where credit facility is scarce and the opportunity of development of company’s business is high.
| Particulars | FY20 | FY21 | FY22 | 30-Jun-22 |
|---|---|---|---|---|
| Number of Super Branches | 92 | 95 | 160 | 167 |
| Number of Normal Branches | 160 | 167 | 140 | 144 |
| TOTAL | 252 | 262 | 300 | 311 |
Speedy growth in Gross Term Loans with a CAGR of 50% on account of operational efficiency The Gross Term Loans of the company has increased from Rs 1008.2 Crores in March 2018 to Rs 5296.5 Crores in June 2022 at a CAGR of 49.76%. The loans of the company are generally issued for a time span of 2-7 years , with 95% of loans sanctioned falling in the interest slab of 24-26%. Morethan 95% loans of the company fall under the category of secured loans with the collateral deposits at the time of fresh issue of loans. These loans comprises majorly in the range of Rs 1 lakh to Rs 10 lakh in value with an Average Ticket Size (ATS) of Rs 3 lakh. The live accounts of the company has increased from 143079 accounts in FY20 to 217745 accounts in FY22 an increase of 52%. This growth in Gross term loans was possible on account of increase in active live accounts where disbursements increased on a stable pace. The company is able to identify appropriate target markets where CRISIL believes there is a wider opportunity for credit growth specially for micro finance.
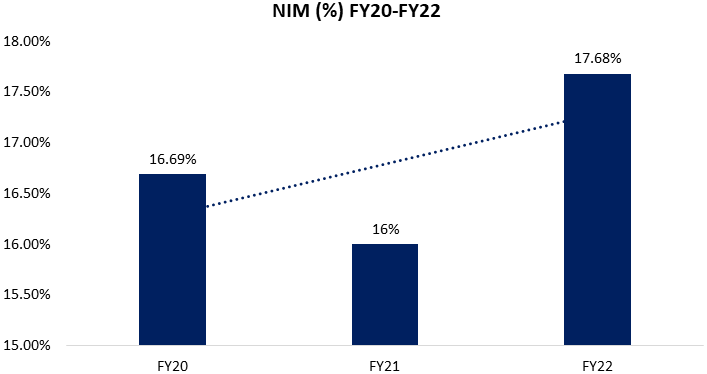
Among its peers the company has highest NIM’s of 15% in FY22, which shows the strong yields the company is able to charge. The company has 4th highest yields on advances at 25% in FY22. Additionally the cost of funds of the company has come down from 13% in FY20 to 10% in FY22.
Operational metrics
| Metric | FY20 | FY21 | FY22 | 30-Jun-22 |
|---|---|---|---|---|
| Live Accounts | 143079 | 176467 | 217745 | 230175 |
| Branches | 252 | 262 | 300 | 311 |
| Number of Loans Disbursed | 76634 | 48111 | 63633 | 19793 |
| Disbursements (in Rs cr) | 2408.66 | 1245.05 | 1756.24 | 568.43 |
| Gross Term Loans (in Rs cr) | 3892.22 | 4445.38 | 5067.07 | 5296.5 |
| Gross Term Loans Growth (%) | 84.22 | 14.21 | 13.99 | 4.53 |
| Stage 3 Gross Term Loans to Gross Term Loans (%) | 1.37 | 1.02 | 1.05 | 1.12 |
| Gross Term Loans per Business Officer ( in Rs cr) | 21.22 | 22.14 | 20.54 | 20.77 |
| Disbursement per Business Officer (in Rs cr) | 16.79 | 6.52 | 7.92 | 2.27 |
| Average number of Business Officers per branch | 7.28 | 7.66 | 8.22 | 8.2 |
| Average Ticket Size (in Rs cr) | 0.031 | 0.026 | 0.028 | 0.029 |
| 30+ DPD to Gross Term Loans (%) | 11.82% | 12.36% | 16.78% | 15.71% |
| 60+ DPD to Gross Term Loans (%) | 6.67% | 6.47% | 6.60% | 8.03% |
Financial metrics
| Metric | FY20 | FY21 | FY22 | 30-Jun-22 |
|---|---|---|---|---|
| Average Yield on Gross Term Loans (%) | 24.18 | 24.17 | 24.05 | 24.15 |
| Average Cost of Borrowing (%) | 12.07 | 11.48 | 10.51 | 10.53 |
| Net Interest Margin (%) | 16.69 | 16 | 17.68 | 19.17 |
| Operating Expenses to Average Total Assets(%) | 4.85 | 4.16 | 4.86 | 5.51 |
| Impairment loss allowance to Average Total Assets (%) | 1.38 | 0.69 | 0.72 | -0.03 |
| Cost to Income Ratio (%) | 38.97 | 34.3 | 36.91 | 32.25 |
| Profit for the period / year after tax (in Rs cr) | 261.95 | 358.99 | 453.54 | 139.43 |
| Net Profit Margin | 33.27 | 34.15 | 36.11 | 41.12 |
| Profit per employee (in Rs cr) | 0.09 | 0.09 | 0.04 | 0.02 |
| Net Worth (in Rs cr) | 1944.58 | 2318.17 | 3710.35 | 3856.97 |
| Total Borrowings (in Rs cr) | 2363.69 | 3425.19 | 2558.83 | 2520.31 |
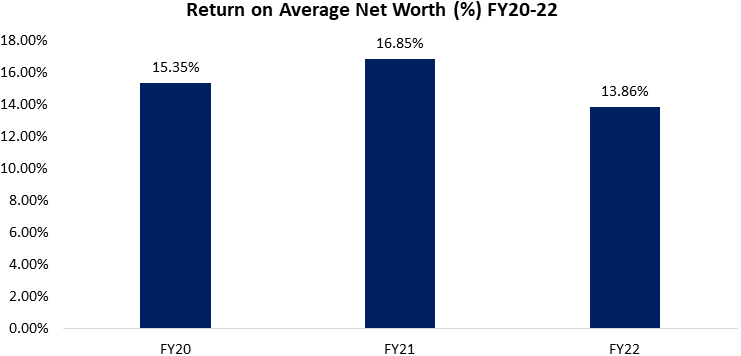
| Return on Average Net Worth (%) | 15.35 | 16.85 | 13.86 | 3.69 |
| Gross Term Loans on Restructured Accounts (in Rs cr) | NA | NA | 73.8 | 71.06 |


Increased Asset under Management and cost effectiveness in borrowings of the company
Five star business recorded 4th fastest AUM growth of 50% CAGR from FY18-22
among the compared peers. The branch growth rate of Five Star Business is 3rd
highest among its peers between FY18-22 at a CAGR of 23%. The AUM per branch on
account of increasing branches of the company has reached Rs 17 crores over FY18-22
implying CAGR of 21%. Further, the company has the 3rd lowest ‘cost
to income ratio’ of 32% incomparison to its peers like Aptus Value Housing
(lowest 18%) followed by Aavas Financiers at 31%.
The cost of borrowings decreased from 11% in FY20 to 9% in FY22. This is possible because of strong credit ratings, efficient risk management policies, strong equity position and low leverage levels.
AUM per branch (in Rs cr)
| Name of the Lender | FY20 | FY21 | FY22 |
|---|---|---|---|
| Five Star Business Finance Ltd. | 15.4 | 17 | 16.9 |
| Aavas Financiers Ltd. | 31.2 | 33.8 | 36.1 |
| Aptus Value Housing Finance Ltd. | 18.2 | 21.4 | 24.9 |
| AU Small Finance Bank Ltd. | 17.4 | 19.3 | 18 |
Disbursement per branch (in Rs cr)
| Name of the Bank | FY20 | FY21 | FY22 |
|---|---|---|---|
| Five Star Business Finance Ltd. | 9.6 | 4.8 | 5.9 |
| Aavas Financiers Ltd. | 11.7 | 9.5 | 11.5 |
| Aptus Value Housing Finance Ltd. | 7.3 | 6.8 | 7.9 |
| AU Small Finance Bank Ltd. | 7.5 | 6.3 | 5.2 |

Successfully expanded network in geographically under penetrated markets
The company has consistently focused on South India where it has seen significant
growth during 2010 to 2015. It’s focus is on individual entrepreneurs , and
MSME’s who are in need of credit assistance. Going forward the company is
positive on expanding its footprints to other geographies besides Southern India
in order to cater to underserved areas of the country. Company has strategic expansion
plan where it establishes pilot branches at first to gain a deeper understanding
of particular area with focus on customer demand, sourcing opportunities, legal
and technical evaluation, etc. The company has previously applied this strategy
successfully in Madhya Pradesh, Andhra Pradesh and Telangana . Currently 15% of
the company’s branches are new and operational for less than 12 months.
Peer Comparison
| Name of the Bank | GNPA | P/BV | NIMs (%) | ROA (%) | ROE (%) | Yield on Advances (%) | Cost of funds (%) | NPM (%) |
|---|---|---|---|---|---|---|---|---|
| Five Star Business Finance Ltd. | 1.10% | 3.71 | 14.90% | 7.50% | 15.00% | 24.70% | 10.00% | 36.00% |
| Aavas Financiers Ltd. | 1.00% | 7.30 | 6.50% | 3.60% | 13.70% | 12.80% | 6.70% | 27.00% |
| Aptus Value Housing Finance Ltd. | 1.20% | 5.80 | 11.40% | 7.30% | 15.10% | 17.20% | 8.00% | 44.00% |
| AU Small Finance Bank Ltd. | 2.00% | 5.25 | 5.40% | 1.90% | 16.40% | 12.10% | 5.30% | 16.00% |
Risks
Lending business is exposed to inherent risk of fluctuations in interest rates
The company is exposed to market risk which involves losses in financial investments
which may occur due to adverse moment in prices of investments, fluctuations in
interest rates, etc, which may further impact the business of the company significantly.
Current Issue is pure OFS & Overhang of further supply from pre-IPO investors
This means all funds raised will go to respective sellers & not to the company.
Secondly the company has many marquee PE firms as its investors. This increases
risk of continuous supply of paper from these Pre-IPO investors.
Valuation
Five star Business Finance Ltd. is an old NBFC with a dominant presence in southern India. The company has consistently grown its customer base with an average ticket size of around Rs 3 lakh in FY22. Going forward it aims to increase its live loan accounts by spreading into other geographies of India with focus on MSME & individual entrepreneurs. On profitability front the company has highest NIMs among its peers with very competitive cost of funds. On valuation front on upper band of asking price in IPO, the company would be trading at P/BV of 3.71x as on FY22 as compared to its peers set valuation ranging between 5.25 to 7.3x P/BV.
The valuation appears to be not very demanding as compared to peers. However in our view the overhang of continuous supply of paper from pre-IPO investors (PE funds) may cap the upside in stock over medium to long term. There may be some listing gains possibility but the space is very crowded & there are enough other opportunities which may offer better risk reward.
Hence we recommend ‘Subscribe ONLY for listing gains’. In our view investors should exit at the listing & reassess stock’s potential for long term holding at a later date.
Key Information
Use of Proceeds:
- The offer is an ‘Offer for sale’ of 4.1 crore shares and the company intends to garner Rs 1960 Crores.
- The company aims to achieve the benefits of listing the equity shares and the proceeds will solely remain with selling shareholders.
Book running lead managers:
ICICI Securities, Edelweiss Financial, Kotak Mahindra Capital, Nomura Financial
Management:
Lakshmipathy Deenadayalan (Promoter, Chairman and Managing Director), Rangarajan
Krishnan (CEO), Srikanth Gopalakrishnan ( Chief of Strategy and Finance)
Financial Statement
Profit & Loss Statement:- (Consolidated)
| Particulars | FY20 | FY21 | FY22 | 30-Jun-22 |
|---|---|---|---|---|
| Equity Share Capital | 25.58 | 25.65 | 29.13 | 29.14 |
| Reserves | 1919.00 | 2292.50 | 3681.20 | 3827.80 |
| Revenue from Operations | 786.70 | 1049.70 | 1254.60 | 337.97 |
| Revenue Growth (%) | - | 33.43% | 19.52% | 12.46% |
| EBITDA | 576.30 | 813.00 | 917.00 | 254.58 |
| EBITDA (%) | 73.25% | 77.45% | 73.13% | 75.33% |
| Profit/Loss Before Tax | 349.30 | 476.40 | 604.20 | 186.10 |
| Net Profit for the period | 261.95 | 358.99 | 453.55 | 139.43 |
| Net Profit (% ) | 33.27% | 34.15% | 36.11% | 41.12% |
| EPS-Basic (Rs) | 10.32 | 14.01 | 16.09 | 4.79 |
| RONW (%) | 13.47% | 15.49% | 12.22% | 3.62% |
| NAV (Rs) | 71.68 | 85.26 | 127.35 | 132.58 |
Key Valuation Metrics
| Valuation Metrics | FY22 |
|---|---|
| ROA (%) | 7.16% |
| ROE (%) | 13.86% |
| Cost to Income ratio (%) | 36.91% |
| P/BV (x) | 3.71 |
| GNPA (%) | 1.1 |
| NNPA (%) | 0.7 |
| Average Yields on Disbursements (%) | 24.77 |
| Capital Adequacy Ratio (%) | 75.2 |
| Total Borrowings to Total Equity ratio (x) | 0.69 |