Intellect Design Arena Ltd
IT - Software Products
Stock Info
Shareholding Pattern
Price performance
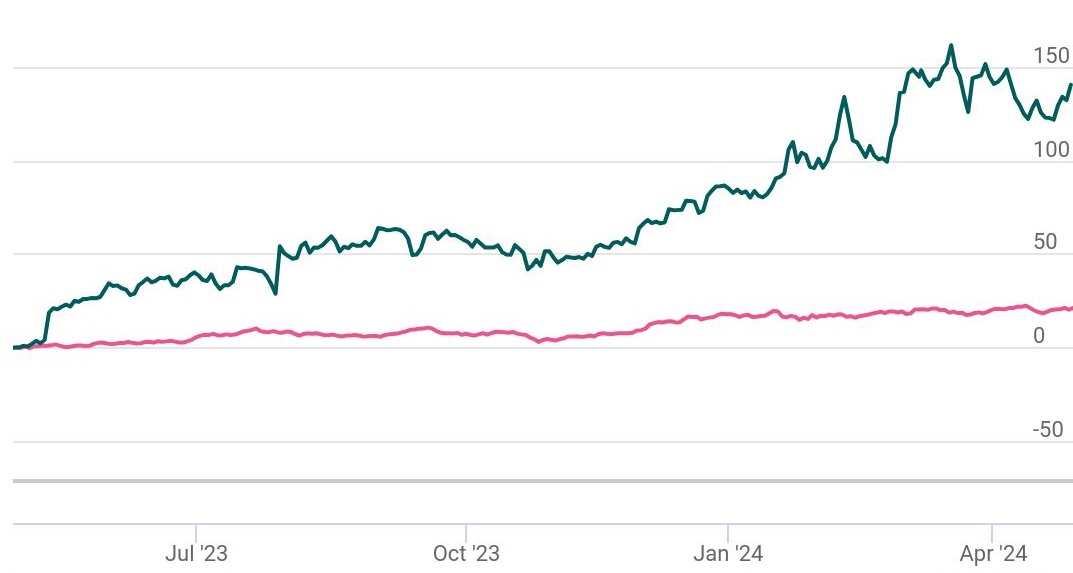
Indexed Stock Performance

Trend Line Breakout, Bullish View

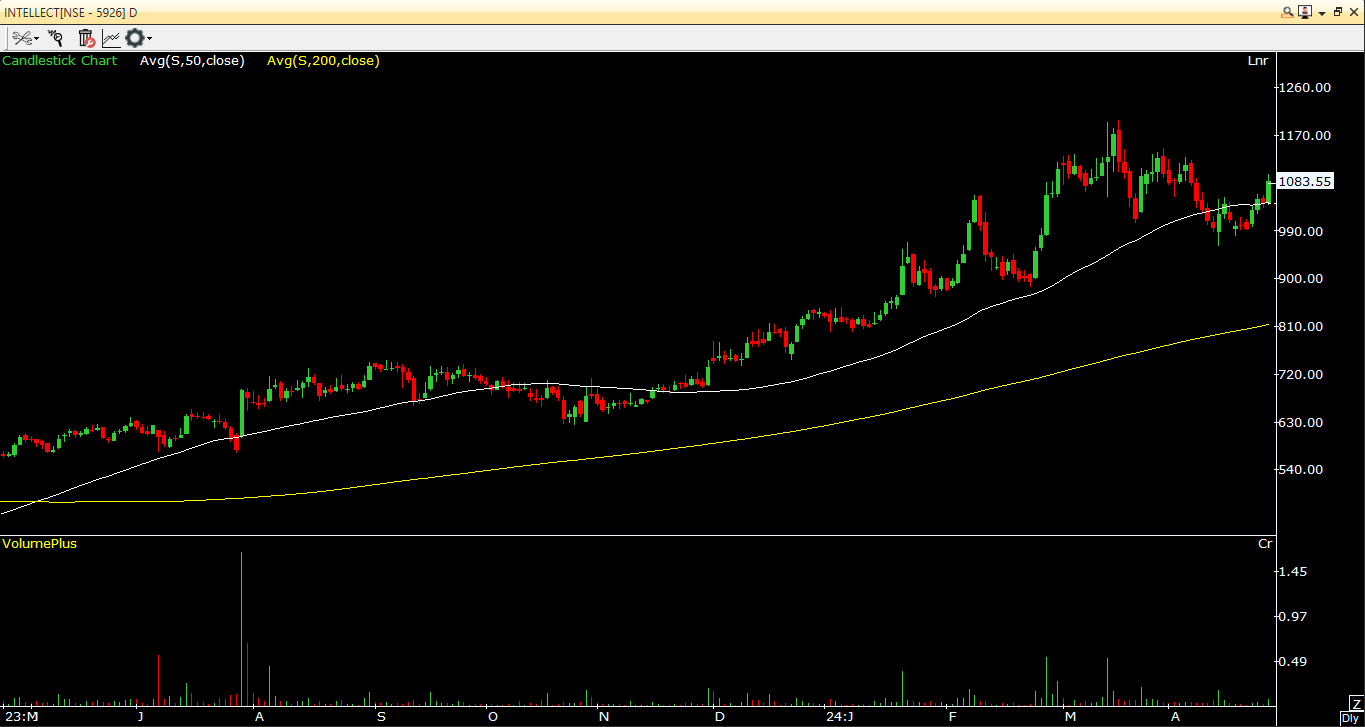
INTELLECT DESIGN has seen trend line breakout on daily chart, trading with double bottom formation on 4 hr chart, which indicated sign of bullishness. The stock is currently placed above all its important moving averages on daily time frames which indicates positive setup. The stock has bounce from the recent swing low of Rs.963, which show bullishness for this stock. The RSI on daily chart is pegged at 56.59, pointing toward the northward direction, indicating the stock has not yet been over bought. Even the MACD histogram is trading in buy territory on daily chart, indicating positive momentum in the stock in the near term.
Trader can accumulate around current level and Rs.1078 with keeping the stop loss Rs.947 for target Rs.1330.