Higher Highs & Higher Lows On Weekly Chart, Bullish View
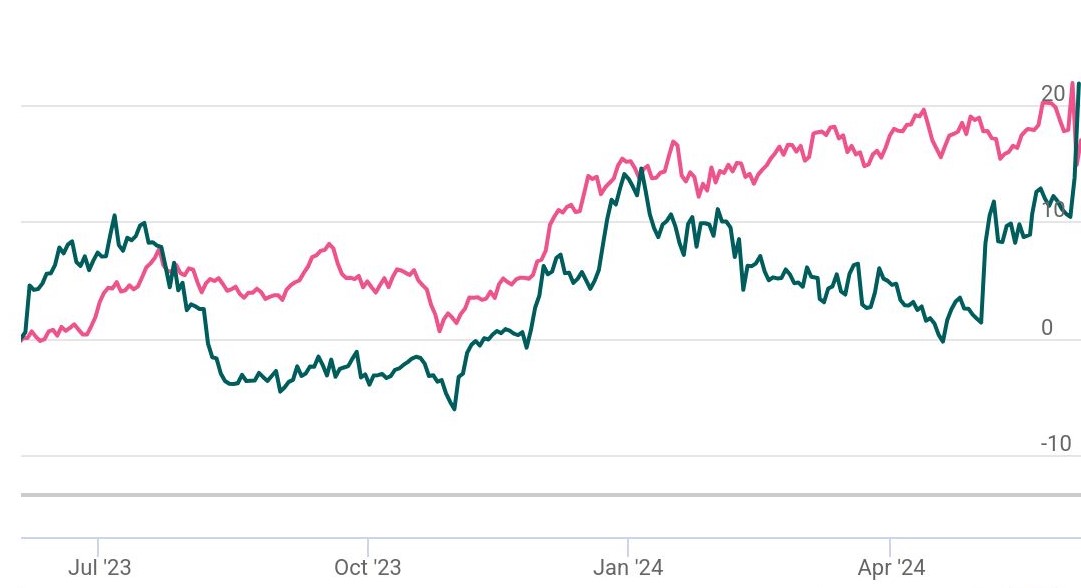
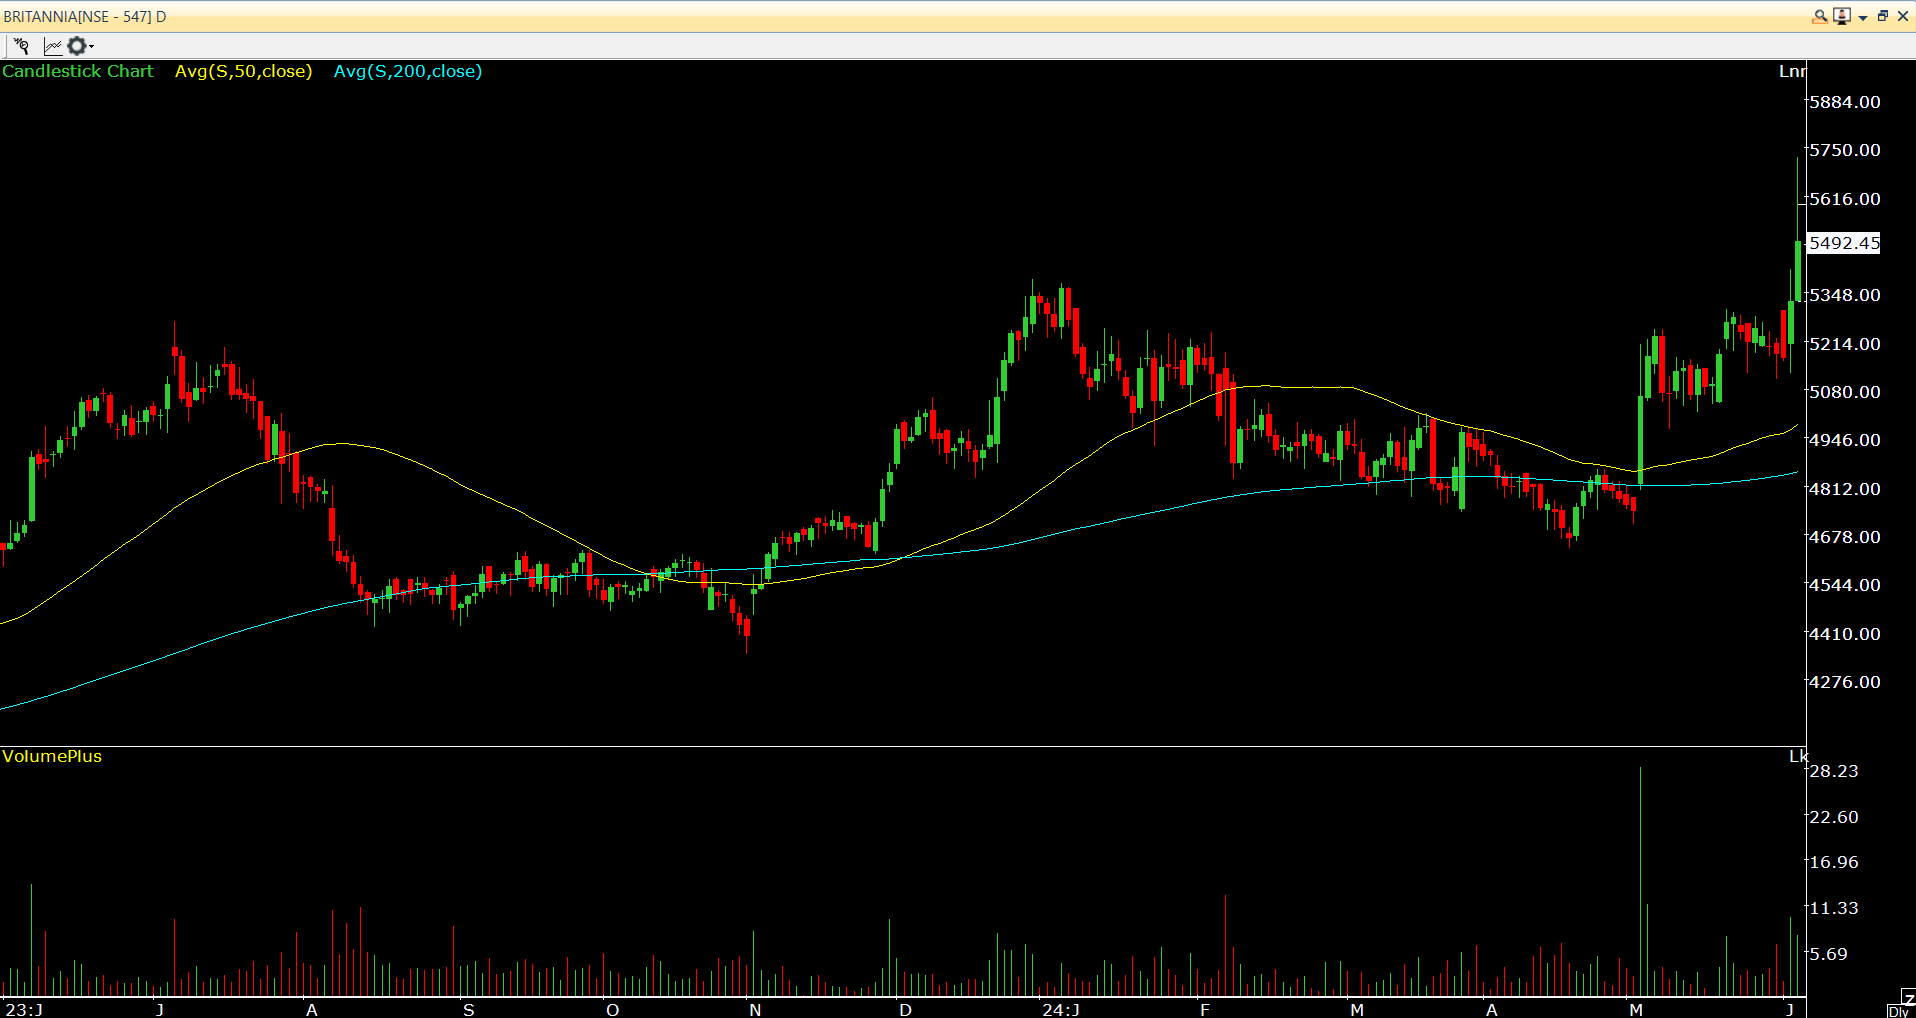
Britannia Inds is one of the preferred picks from the FMCG sector. The stock is in the category of investor friendly stocks and always attracts the market participants. On the weekly chart stock is trading in higher top and higher bottom formation. The accumulation has been seen at Rs.4600 – Rs.5000 levels where support has placed, indicating bullish view for the stock. The stock is trading above a keen moving average 50SMA & 200SMA on daily charts. The stock has bounced from the support level with increase in volume which indicates the strength in the counter. The RSI on the daily chart is pegged at 74.20, making higher lows formation. The Parabolic–Sar is placed below the price below the price on the daily chart, reiterating our positive stance in the counter. Even the MACD is trading above the signal in buy territory on the weekly chart, indicating positive momentum in the stock in the near term.
Trader is advised to buy the stock around Rs.5549 with the stop loss placed below Rs.4880 for the targets of Rs.6900.
Consolidated Financial Statements


