Asahi India Glass Ltd
Glass
Stock Info
Shareholding Pattern
Price performance
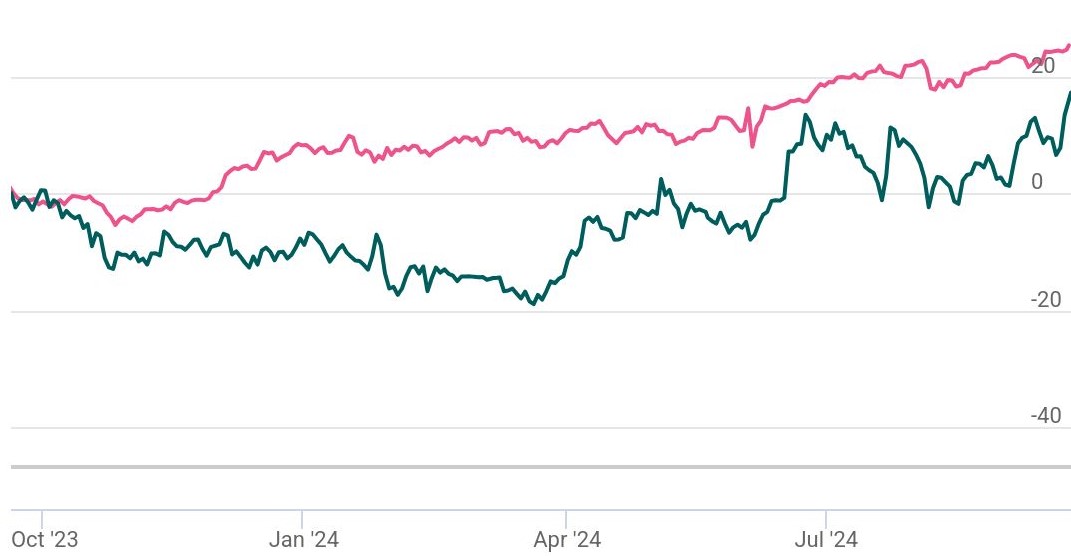
Indexed Stock Performance

Ready For Bull's Ride

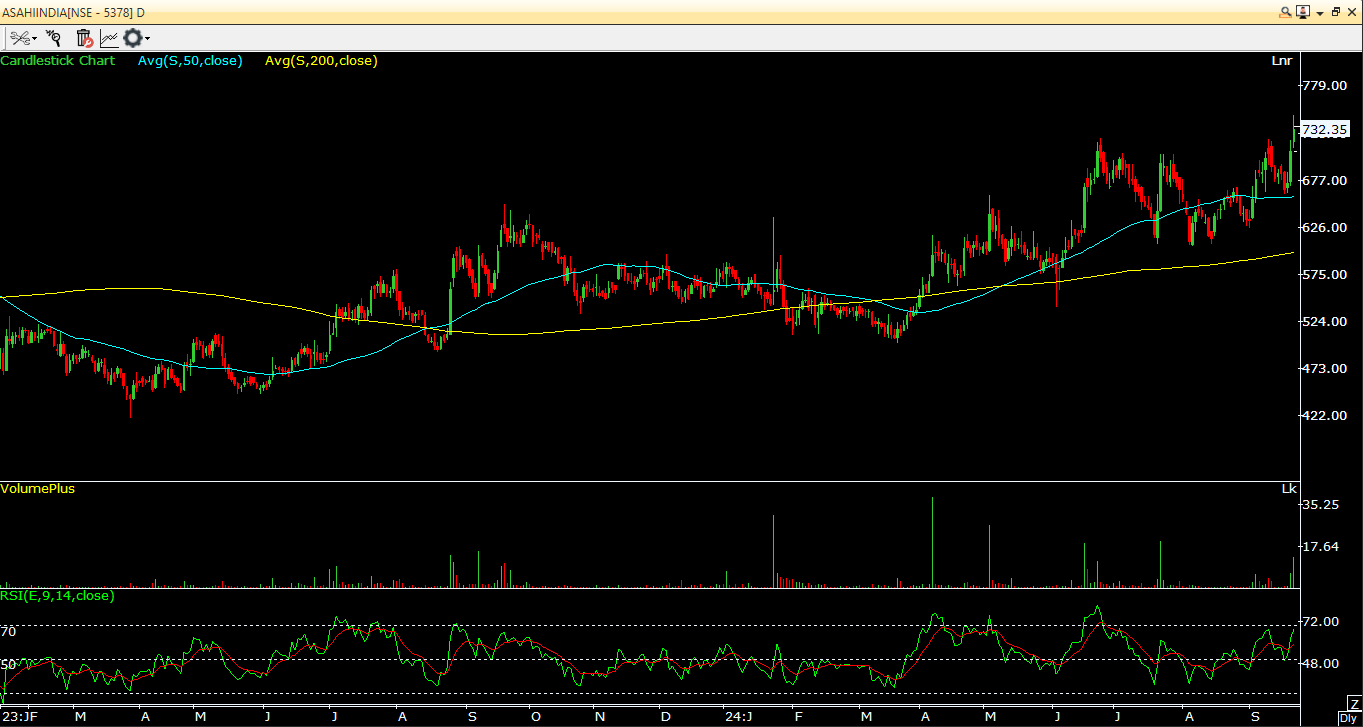
ASAHI INDIA GLASS has been experiencing a sustained bullish trend for several weeks, characterized by a consistent pattern of higher highs and higher lows on the weekly charts, which remains intact. This trend reflects the underlying strength of the stock, and any technical pullbacks present a favorable opportunity for investors to accumulate shares during dips. On the daily chart, the stock is positioned above all significant moving averages (20 SMA and 50 SMA), reinforcing its bullish outlook. Additionally, the Parabolic SAR on the daily chart is situated below the price, suggesting that upward momentum is likely to persist. In terms of oscillators, the RSI (14) on the daily chart has recently achieved a positive crossover with the 9-period moving average, further supporting our optimistic view of this stock. Furthermore, the Bollinger Band (20, 2, S) configuration on the daily chart has begun to expand, with the stock currently trading above the upper band, indicating an increase in volatility on the upside.
Considering the above data facts, we recommend for trader to enter the stock at the current levels while any dip around Rs.700 – Rs.710 can be utilized to average for targets of Rs.845, with keeping a stop loss below Rs.655.