Ajanta Pharma Ltd
Pharmaceuticals & Drugs - Global
Stock Info
Shareholding Pattern
Price performance
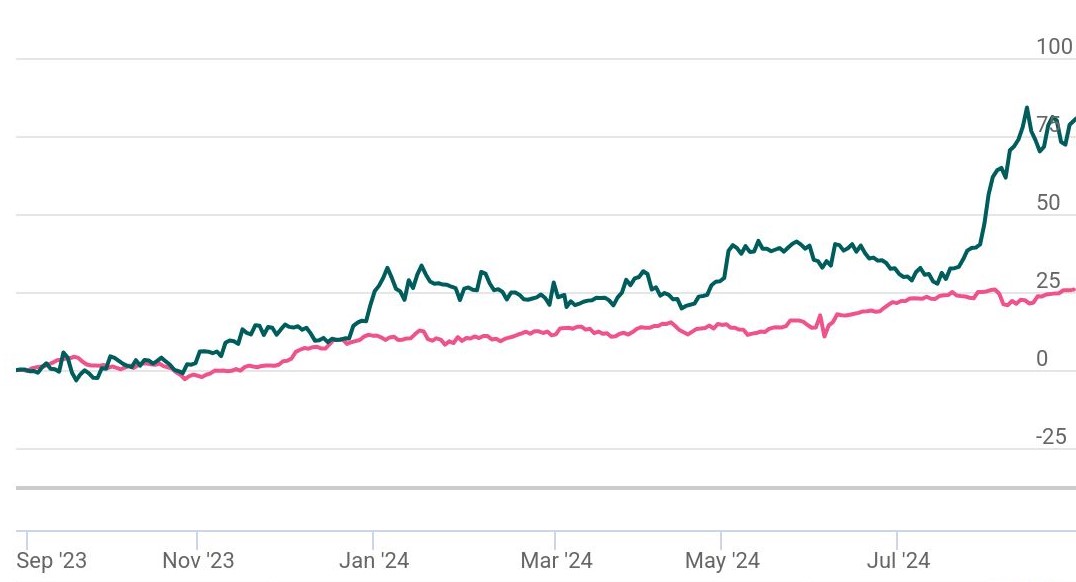
Indexed Stock Performance

Trading Near Swing High, Bullish View

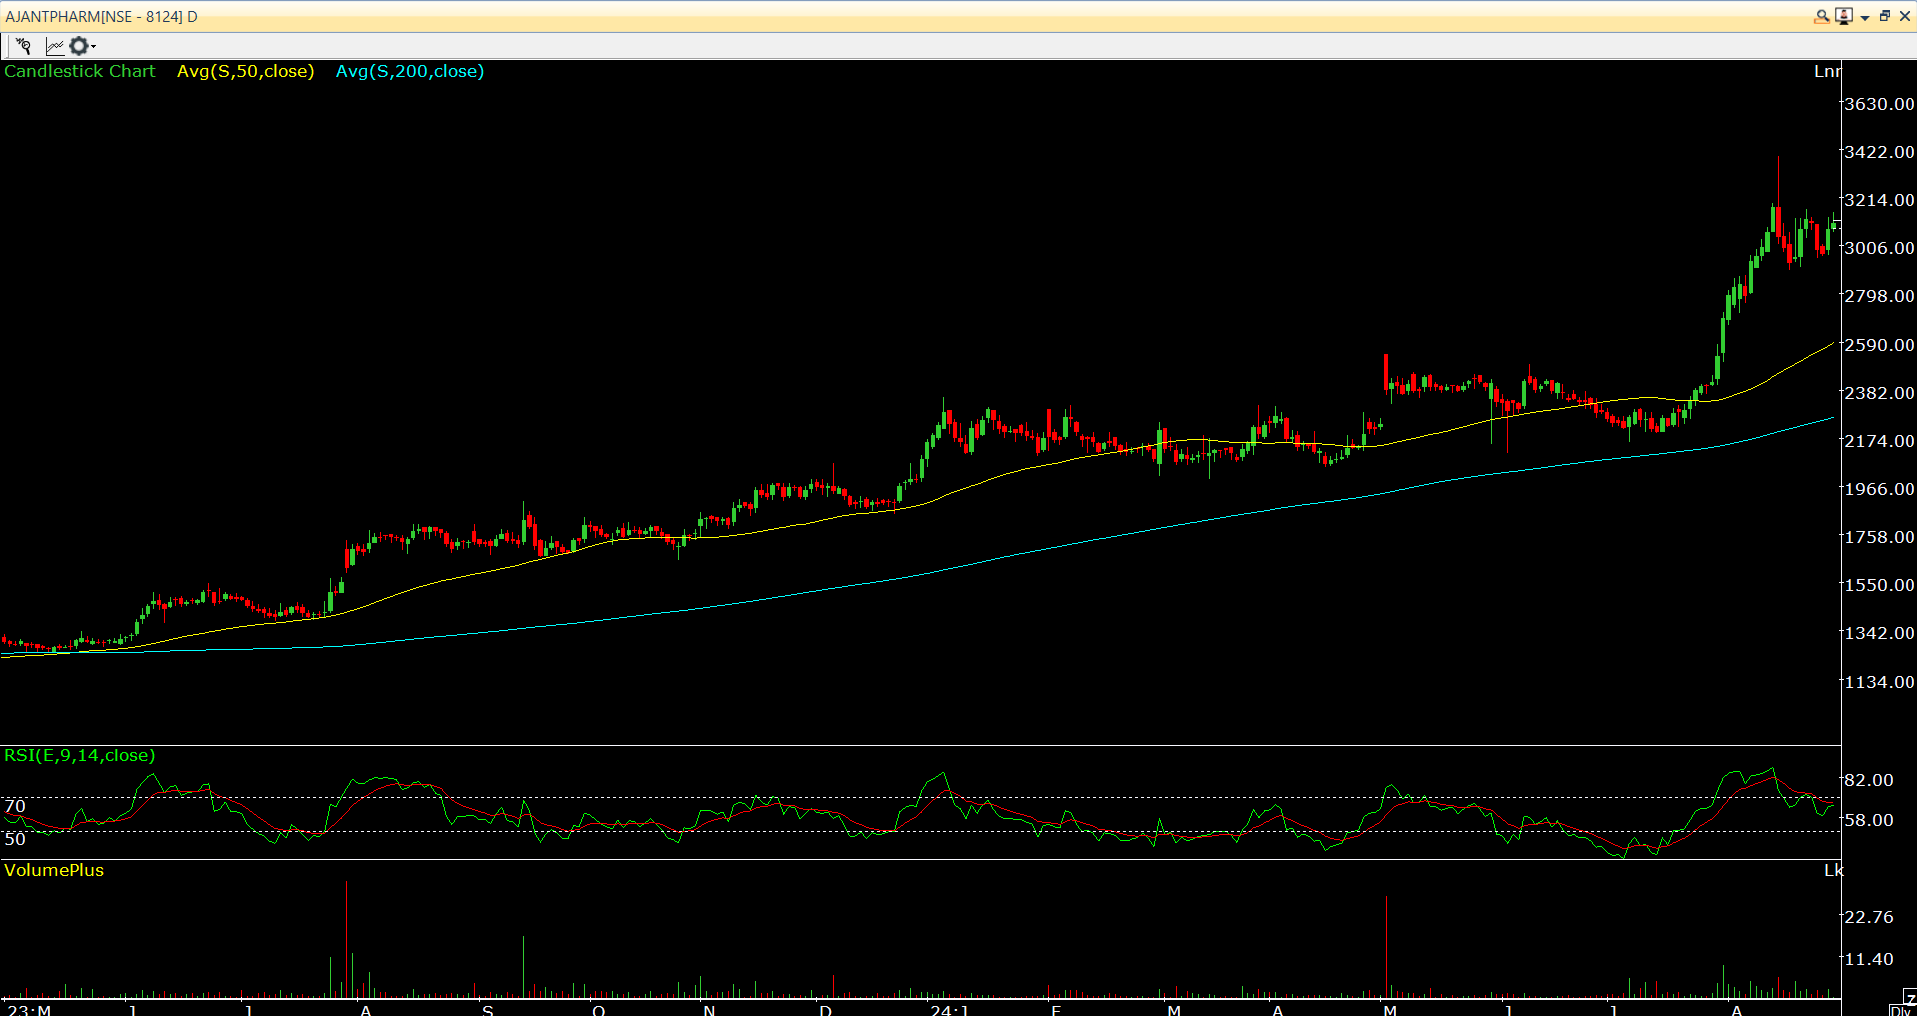
Ajanta Pharma has experienced a notable increase of 17.83% over the past month, following a low of Rs. 2083 reached on June 4, 2024, which marked the conclusion of a short-term downtrend for the stock. In the long term, the stock is exhibiting a consistent upward trajectory after undergoing a cyclical correction. Over the last month, it has significantly outperformed the NIFTYPHARMA index. We anticipate that this outperformance will persist in the upcoming weeks. Currently, the stock is trading above key moving averages, including the 20-day, 50-day, and 200-day simple moving averages on both daily and weekly charts. The Bollinger Band (20, 2, S) configuration on the daily chart has begun to widen, with the stock trading above the median line, suggesting an increase in volatility on the upside. The Relative Strength Index (RSI) on the daily chart is positioned below 65.06, indicating that the stock has not yet reached overbought conditions. Additionally, the Parabolic SAR is situated below the price action on the weekly charts, reinforcing the notion that the upward trend in the stock is likely to remain intact in the near term. The MACD is also positioned above the signal line in the buy territory on the weekly chart, signaling positive momentum for the stock in the near future.
Traders may go long on the stock at current levels while any correction around Rs.3000 – Rs.3050 can be utilized to average while keeping a stop loss below Rs.2750 for target of Rs.3670.